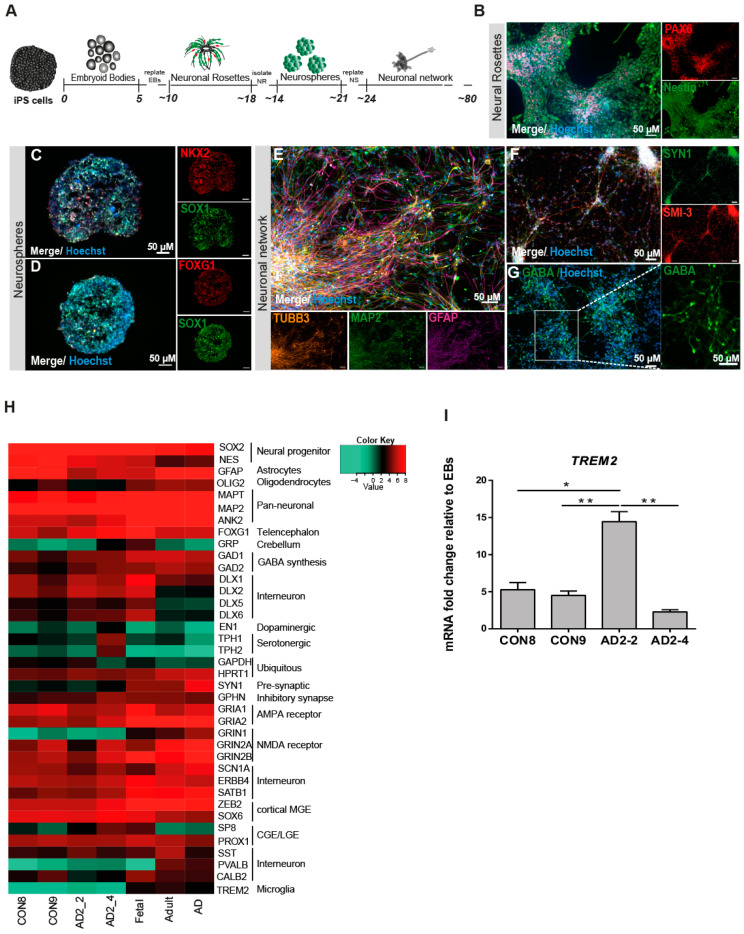
Figure 1.
Differentiation and characterization of iPSC-derived neuronal cultures. (A) Scheme illustrating the main stages of the differentiation protocol for generating iPSC-derived neuronal network enriched in GABAergic interneurons. (B-G) Representative immunocytochemistry images of (B) neural rosettes expressing the progenitor markers PAX6 (red) and Nestin (green), (C) neurosphere expressing the progenitor marker SOX1 (green) and the MGE marker NKX2.1 (red), (D) neurosphere expressing the progenitor marker SOX1 (green) and the forebrain marker FOXG1 (red), (E) neuronal network expressing the pan-neuronal markers TUBB3 (orange) and MAP2 (green) as well as GFAP (magenta), (F) neural maturation markers SYN1 (green) and SMI-3 (red) and (G) interneurons expressing the neurotransmitter GABA (green). Nuclei are stained with Hoechst. Scale bar, 50 µM. (H) Heatmap of Pearson correlation analysis of RNA-seq data from neural differentiation of control (CON8 and CON9) and AD lines (AD2_2 and AD2 _4) and commercially bought RNA from fetal, adult and AD brain for neural progenitor, early neuronal and mature dopaminergic, serotonergic, GABAergic interneuronal markers and glia markers. (I) Relative gene expression of TREM2 in iPSC-derived GABAergic interneurons network from control and AD lines shown as fold change relative to embryoid bodies (EBs). * p < 0.05, ** p < 0.01, one-way ANOVA, followed by Tukey´s multiple comparisons test. Data are presented as mean ± SEM from three independent experiments.

