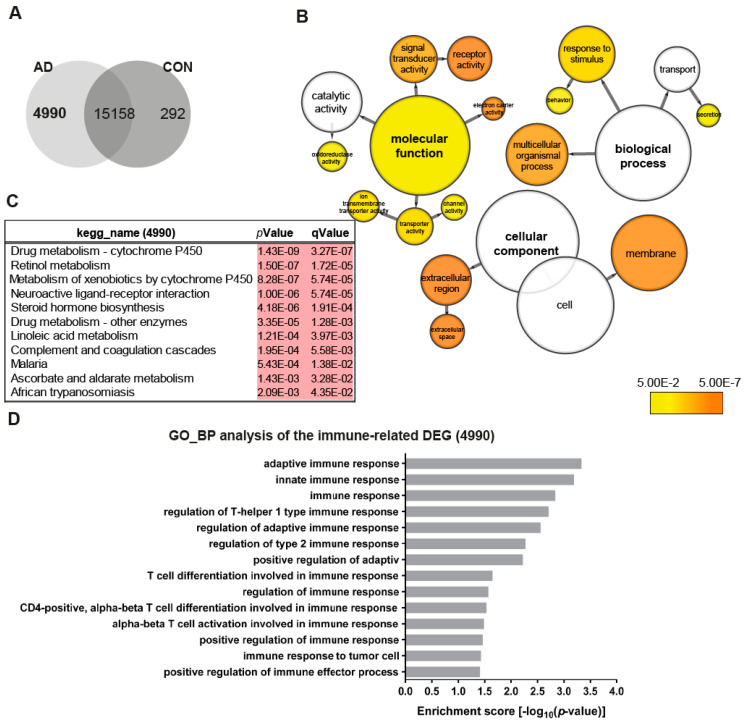
Figure 2.
Distinct gene expression profiles associated with AD neuronal networks. (A) Venn diagram illustrating genes exclusively expressed in the AD neural network (4990), the control (CON) network (292) or common between both (intersection -15158) (detection p-value < 0.05). (B) BiNGO analysis of the differentially expressed genes (DEGs; 4990) exclusively expressed in the TREM2 neuronal network (4990). The orange color of the circles correspond to the level of significance of the over-represented gene ontology (GO) category and the size of the circles is proportional to the number of genes in the category (p-value < 0.05). (C) Kyoto Encyclopedia of Genes and Genomes (KEGG) pathway analysis of the genes exclusively expressed in the AD neuronal network (4990). (D) Significantly enriched gene ontology (GO) terms (biological processes) of the genes exclusively expressed in the AD neuronal network (4990) associated with immune system processes (p-value < 0.05).

