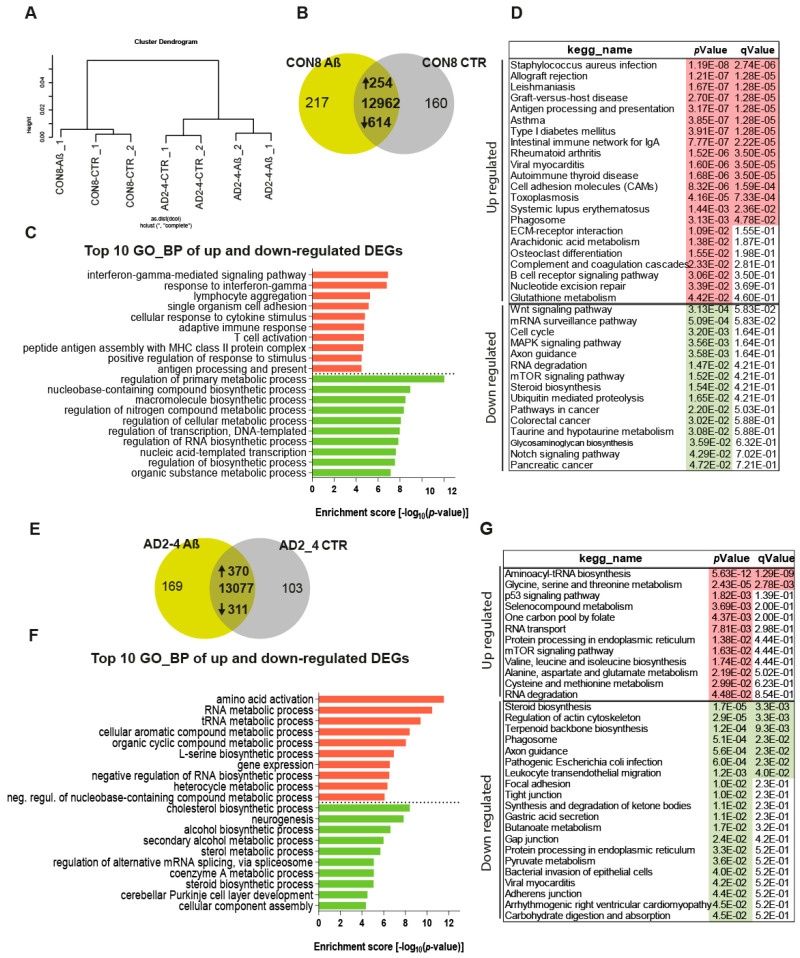
Figure 4.
Gene expression profiles of the CON8 and AD neural cultures stimulated with the Aβ-S8C dimer. (A) Dendrogram obtained by hierarchical cluster analysis of microarray-based (Affymetrix) gene expression data for CON8 and AD2-4 stimulated with the Aβ-S8C peptide. Transcriptomes of CON8_CTR cluster with CON8_ Aβ while those of the AD2-4_CTR cluster separately with TREM2-4_ Aβ. (B) Venn diagram showing genes expressed only in the CON8 neural network subjected to Aβ-S8C peptide stimulation (green), the control condition (grey) and common to both conditions (intersection; detection p value < 0.05). (C) Top 10 significantly enriched gene ontology (GO) terms for biological processes of DEGs upregulated (254-red) and downregulated (614-green) subjected to Aβ-S8C peptide stimulation in CON8 neuronal cultures (p-value < 0.05). (D) KEGG enrichment analysis of up- and downregulated DEGs (p-value < 0.05). (E) Venn diagram showing genes expressed only in the AD2_4 neuronal culture when stimulated with the Aβ-S8C peptide (green), the control condition (grey) and common to both conditions (intersection; detection p value < 0.05). (F) Top 10 significantly enriched gene ontology (GO) terms for biological processes of DEGs upregulated (370-red) and downregulated (311-green) subjected to Aβ-S8C peptide stimulation in the AD2_4 neuronal cultures (p-value < 0.05). (G) KEGG enrichment analysis of up- and downregulated DEGs (p-value < 0.05).

