Figure 5.
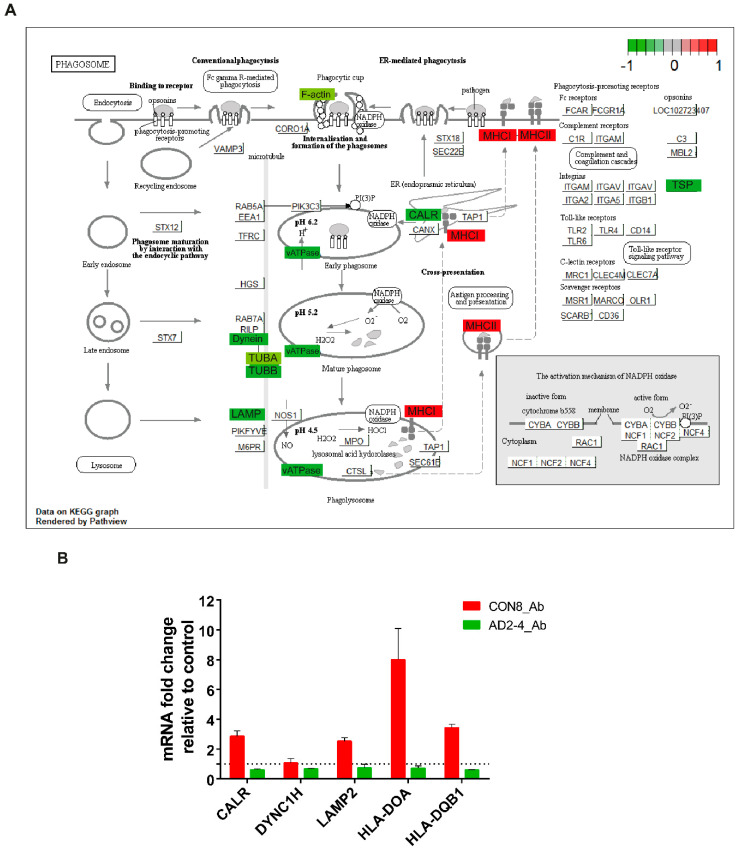
Representation of the KEGG phagosome pathway. (A) Upregulated DEGs genes in response to Aβ-S8C peptide stimulation in CON8 neuronal cultures are shown as red boxes and downregulated DEGs in AD2-4 neuronal cultures are shown as green boxes. (B) Relative gene expression of CALR, DYNC1H, LAMP2, HLA-DOA and HLA-DQB1 analyzed by RT-PCR. Data are presented as mean ± SEM from two independent experiments.

