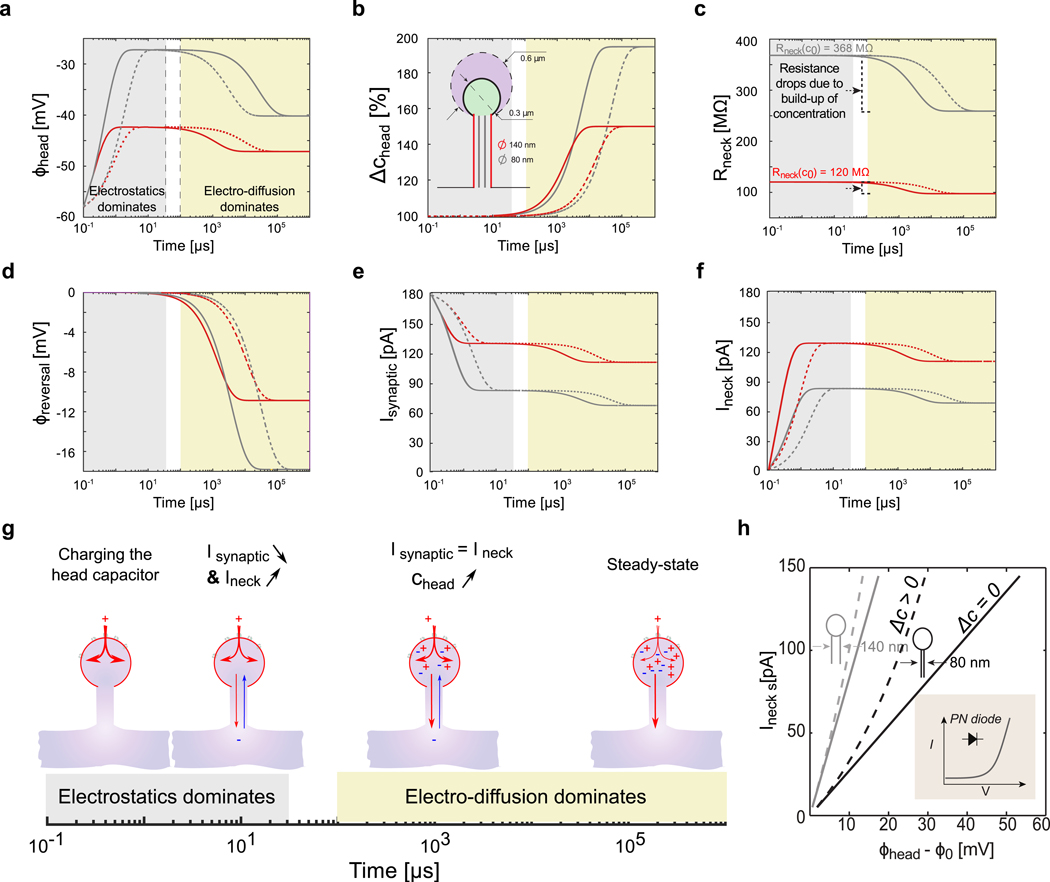
Figure 2. Slow-fast dynamics of ion concentration and electrical potential within the spine head during a step entry of positive ions (constant synaptic conductance g+(t) = 3 nS).

a) Log plot of the voltage dynamics within different spine geometries, with large (R = 600 nm, dashed line) and small (R= 300 nm, solid lines) head, and different neck diameters (140 nm (red, Rneck(c0) = 368 MΩ) and 80 nm (grey, Rneck(c0) = 120 MΩ)). The electrostatics forces dominate at small time scales (< 100 μS) and diffusion at larger time scales (> 1 ms). Note the deflection of the electrical potential due to concentration changes and diffusion. b) Log plot of the concentration dynamics. c) Log plot of the neck resistance dynamics. d) Log plot of the synaptic reversal potential dynamics. e) Log plot of the synaptic current dynamics. f) Log plot of the neck current dynamics. g) Dynamical model of synaptic and neck currents. h) I-V curve of dendritic spine for two different neck diameter (140 nm (grey, Rneck(c0) = 368 MΩ) and 80 nm (black, Rneck(c0) = 120 MΩ)). The discrepancy between the spine I-V curve (dashed line, (Δc > 0) when ion concentration change and Ohm’s law with constant resistance (solid line, Δc = 0) is highlighted. For thin and highly resistive neck, the spine behaves like a diode (inset scheme).
