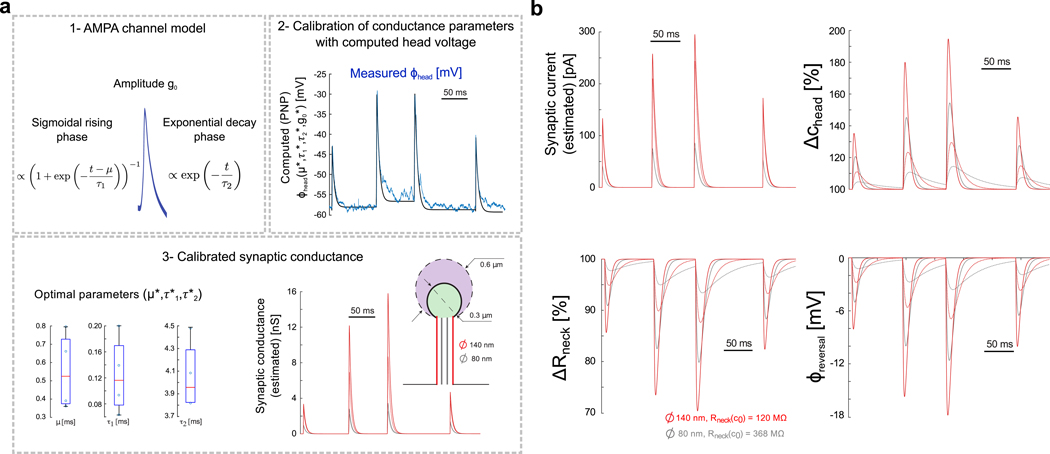
Figure 3. Estimation of synaptic conductance and changes in ionic concentration during experimentally measured EPSPs.

a) Estimating the synaptic conductance during spontaneous activity. 1- Conductance of AMPA receptors is modeled with sigmoidal opening (parameters μ and τ1) and single-exponential closure (parameter τ2). 2- Optimal conductance parameters for each EPSP are estimated with a multi-dimensional grid-search algorithm where the conductance g+(t), the synaptic current (Eq. 10) and the voltage (Eq. 12) are computed for a large range of parameters. Best conductance parameters are those minimizing the distance between the computed and measured EPSPs [8]. 3- Boxplots show fitted parameters for the 4 EPSPs recorded experimentally, and optimal conductance is plotted for the different spine geometries (large (diameter = 140 nm, Rneck(c0) = 120 MΩ, red) and thin (diameter = 80 nm, Rneck(c0) = 368 MΩ, grey) spine neck, and large (diameter = 600 nm, dashed line) and small (diameter = 300 nm, solid line) spine head). b) Dynamics of synaptic current, head concentration, neck resistance and reversal potential as reflected by coarse-grained electro-diffusion model during spontaneous spine activity in the different spine geometries (large (diameter = 140 nm, red) and thin (diameter = 80 nm, grey) spine neck, and large (diameter = 600 nm, dashed line) and small (diameter = 300 nm, solid line) spine head).
