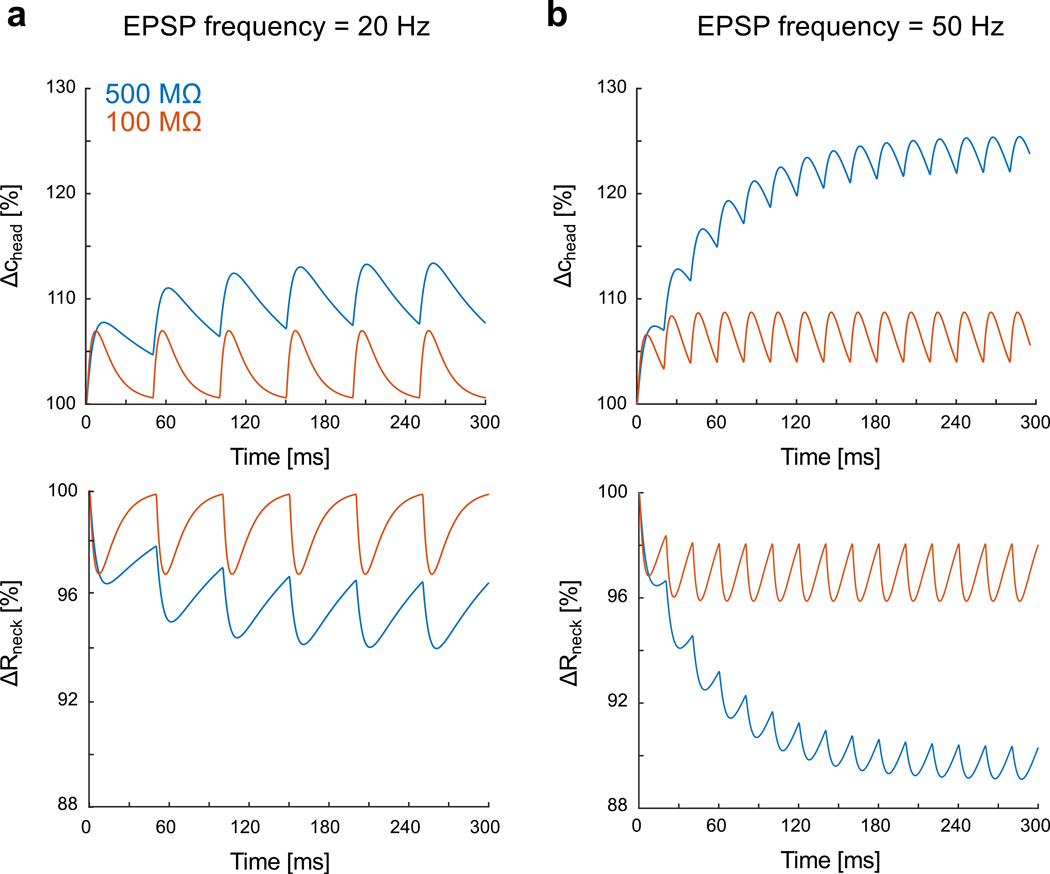
Figure 5: Incremental increase of ionic concentration and associated neck resistance decrease during high-frequency synaptic stimulation.

a) Relative variations of ion concentration in the spine head (R= 300 nm) and associated neck resistance for a 20 Hz synaptic stimulation (geometrical neck resistances (i.e. at concentration c0): 500 MΩ (blue) and 100 MΩ (red)). The kinetics of the synaptic conductance is with maximal conductance and dynamical paramaters b) Relative variations for 50 Hz synaptic stimulation.
