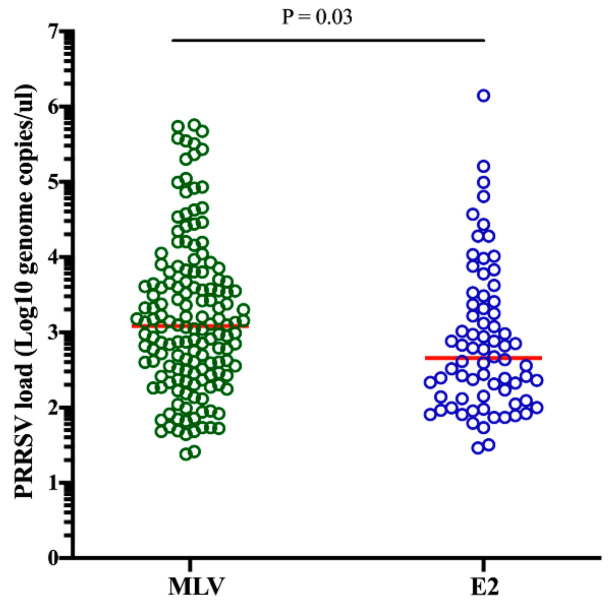
Figure 3.
PRRSV loads in the serum samples from both the CSFV MLV and E2 vaccinated groups. The red horizontal lines represent the median concentrations for each group. Unpaired, 2-tailed Student’s t-tests were used to compare the PRRSV loads between the MLV and E2 groups. P values < 0.05, < 0.01 and < 0.001 were considered statistically significant, highly significant and very highly significant, respectively.

