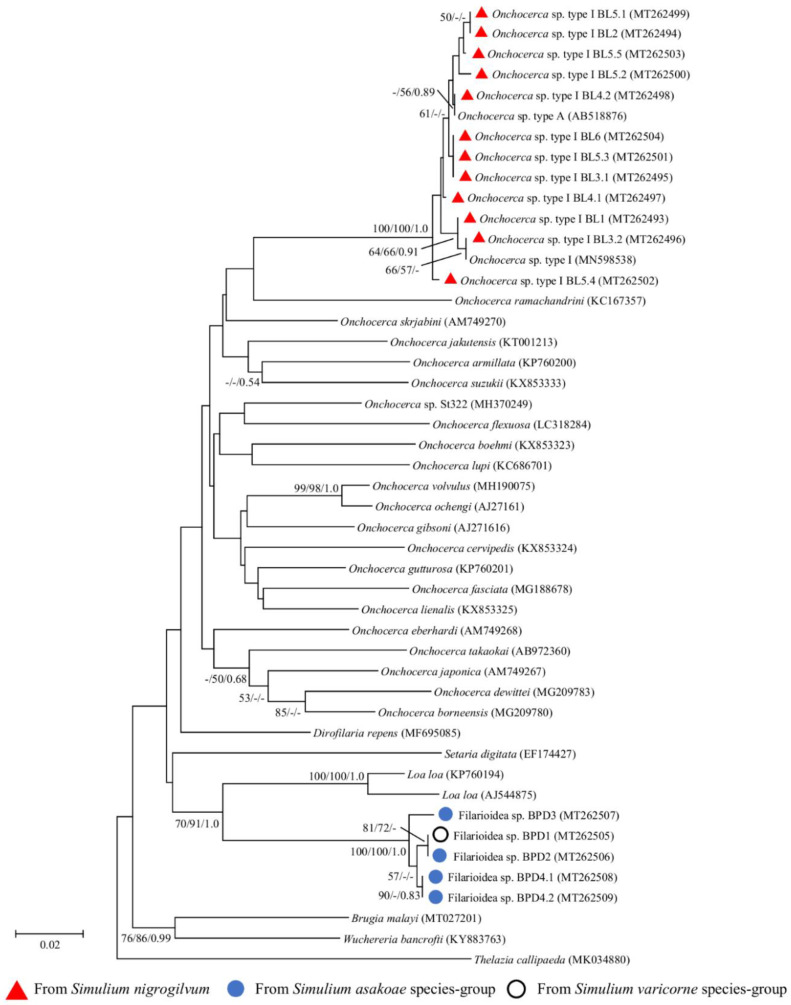
Figure 2.
Neighbor-joining tree of Onchocerca spp. and unknown filarial larvae based on the cox1 gene sequences. Bootstrap values and posterior probabilities (neighbor-joining (NJ)/maximum-likelihood (ML)/Bayesian inference (BI)) are shown above or near the branches. A dash indicates that support values are less than 50% (for NJ and ML) or 0.50 (for BI). The scale bar represents 0.02 substitutions per nucleotide position. Red triangles, blue circles, and white circle with a black border before each specimen designate the specimens obtained from this study and also indicate the vector blackfly species.

