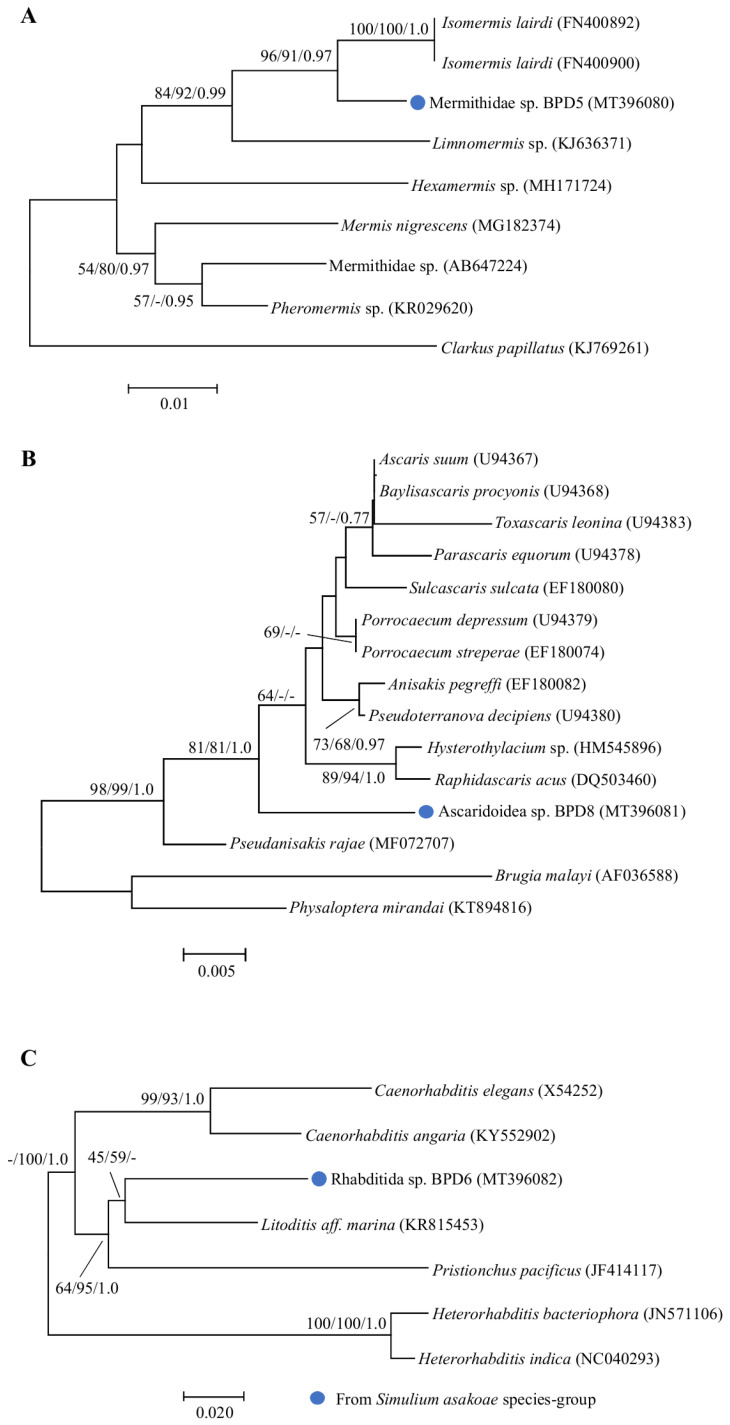
Figure 4.
Neighbor-joining trees of non-filarial nematodes. Bootstrap values and posterior probabilities (NJ/ML/BI) are shown above or near the branches. A dash indicates that support values are less than 50% (for NJ and ML) or 0.50 (for BI). Blue circles before each specimen designate the specimens obtained from this study and also indicate the vector blackfly species. (A) An 18S rRNA tree of mermithid nematodes. (B) An 18S rRNA tree of ascaridoid nematodes. (C) An 12S rRNA tree of rhabditida nematodes.

