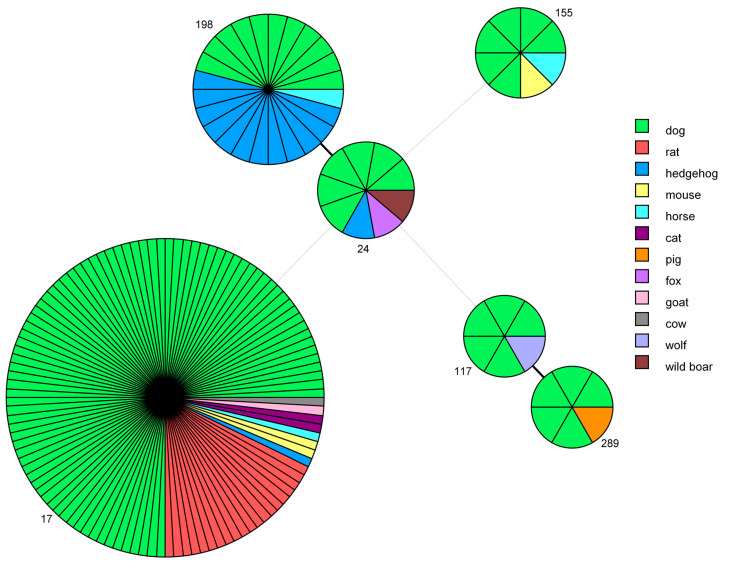
Figure 3.
Minimum spanning tree based on sequence types (STs). Each circle represents one specific ST (assigned numbers are located outside the circles), and the number of sectors corresponds to the number of samples having this ST. The tree is color-coded according to host. Solid black lines represent branches between STs that differ at one locus, while dotted light-grey lines represent branches between STs differing at more than four loci.

