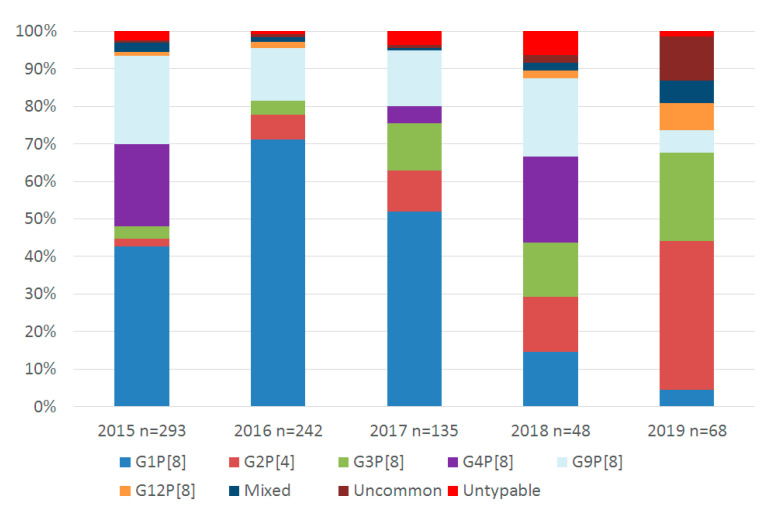
Figure 2.
Genotype diversity in Ireland 2015–2019. Data are presented as the proportion (%) of a specific genotype compared to the total genotype results. Uncommon genotypes: <1% of total results, 2015: G9P[4] n = 2; 2016: G12P[6] n = 2; 2017: G8P[8] n = 1. 2018; G3P[4] n = 1; 2019 G2P[8] n = 1, G3P[4] n = 4, G8P[8] n = 1, G9P[4] n = 2. Mixed genotypes: those with >1 G or P-type, 2015: G1/4P[8] n = 7; 2016: G8/12P[8] n = 1, G2/3P[8] n = 1, G2/9 P[4/8] n = 1; 2017: G1/3P[8] n = 1; 2018: G1/3P[8] n = 1; 2019: G8/12P[8] n = 2, G3/12P[8] n = 1, G8P[8] n = 1, G9/12P[8] n = 1. Untypable results are those where either the G or P type was untypable.

