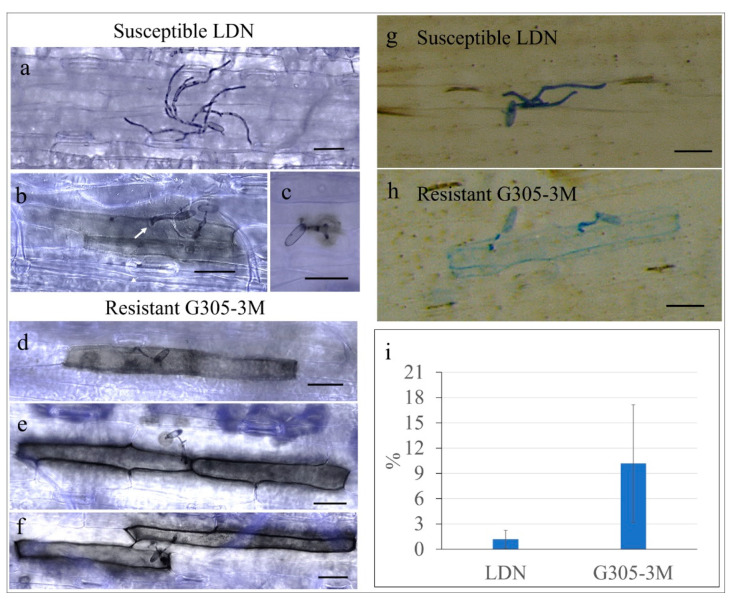
Figure 7.
H2O2 accumulation and programmed cell death in young leaves of resistant G305-3M and susceptible LDN at 2 dpi inoculated with Bgt#70. The leaf samples in (a–f) were stained with DAB-aniline blue, while those in (g,h) were stained with trypan blue. All micrographs were observed under a light microscope; (a–c) H2O2 accumulation and epidermal cell response of susceptible LDN leaves upon Bgt penetration; (d–f) H2O2 accumulated in the epidermal cells of resistant G305-3M leaves upon Bgt penetration. Scale bar is 50 μm. (i) The percentage of germinated Bgt conidia which showed H2O2 accumulation in the resistant G305-3M and susceptible LDN leaf segments. Error bars denote standard deviation based on nine biologic repeats.

