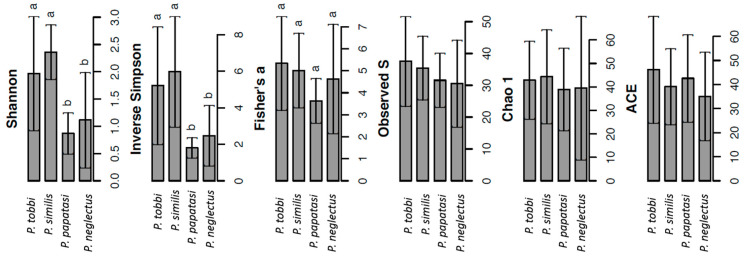
Figure 1.
Analysis of the α-diversity of bacteria in the gut of P. tobbi, P. similis, P. papatasi and P. neglectus based on the calculation of the indices Shannon, Inverse Simpson, Fisher’s alpha, Evenness (S), Chao 1 and Abundance-based Coverage Estimator (ACE). Error bars represent the standard error. Within each index, bars designated by the same letter are not significantly different at the 5% level.

