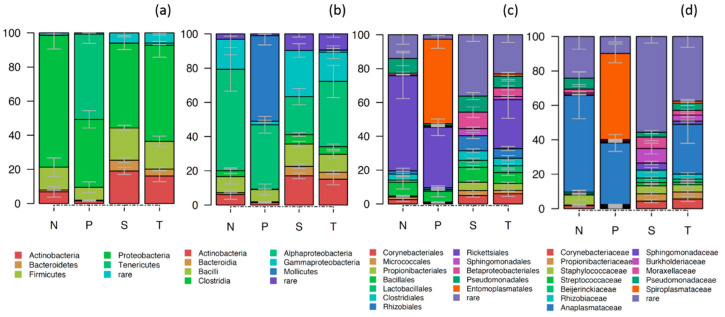
Figure 2.
Stacked bar plot showing the relative abundance of bacteria in the gut of the different Phlebotomus species (N: P. neglectus, P: P. papatasi, S: P. similis and T: P. tobbi) presented at the phylum (a), class (b), order (c) and genus (d) taxonomic level. Error bars represent the standard deviation of three biological replicates. Taxa that participated with less than 1% in 80% or more of the samples analysed were grouped as “Rare”.

