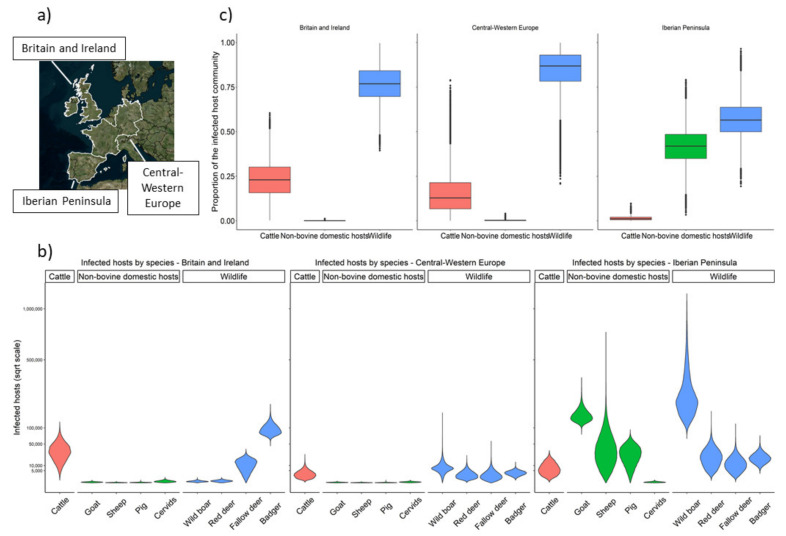
Figure 1.
Estimated number of infected hosts in the three geographical regions. (a) Map of the European study regions; (b) Violin plots of the posterior distribution of the number of infected hosts by region (on the square root scale) with an equal width assigned to each distribution; (c) Boxplots of the proportion of cattle, non-bovine domestic hosts, and wildlife in the infected community by region.

