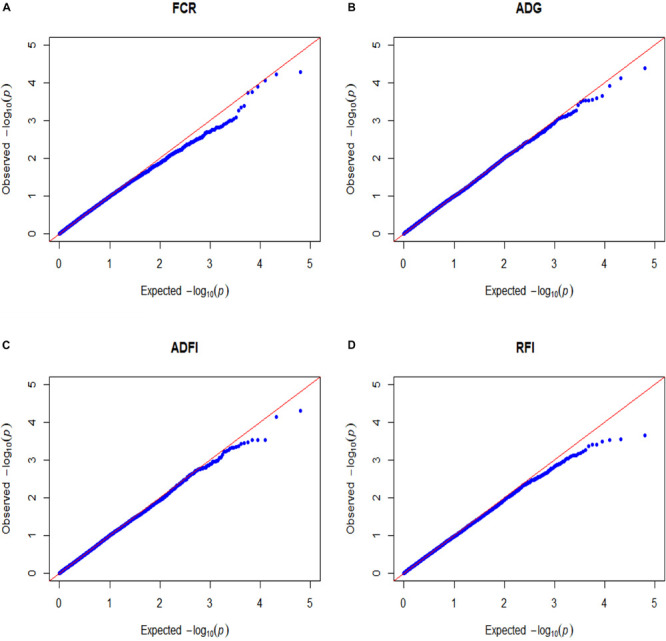
FIGURE 1.

Quantile–quantile plots of GWAS for four feed efficiency traits in a Landrace population. FCR, Feed conversion ratio; ADG, Average daily gain; ADFI, Average daily feed intake; RFI, Residual feed intake. The x-axis and the y-axis represent the expected and observed -log10(P-value). (A) FCR. (B) ADG. (C) ADFI. (D) RFI.
