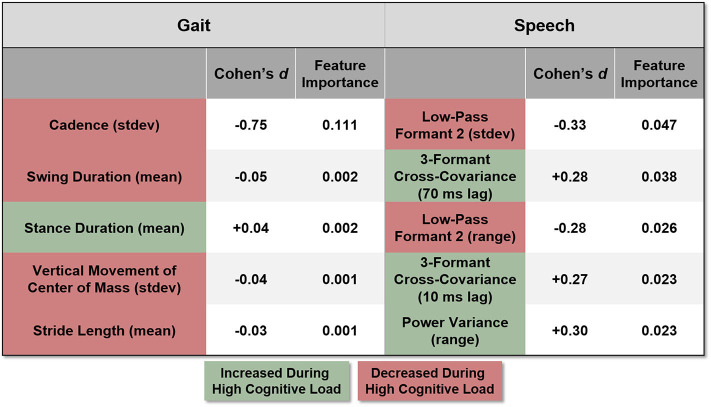
Figure 6.
The most discriminative features within each category are listed. Colors indicate whether the feature value increased (green) or decreased (red) during the high cognitive load condition as compared to the low cognitive load condition. The feature importance values, generated from the random forest algorithm, represent a normalized value across all the features. The Cohen's d value shows the effect size for that feature in discriminating the load levels.

