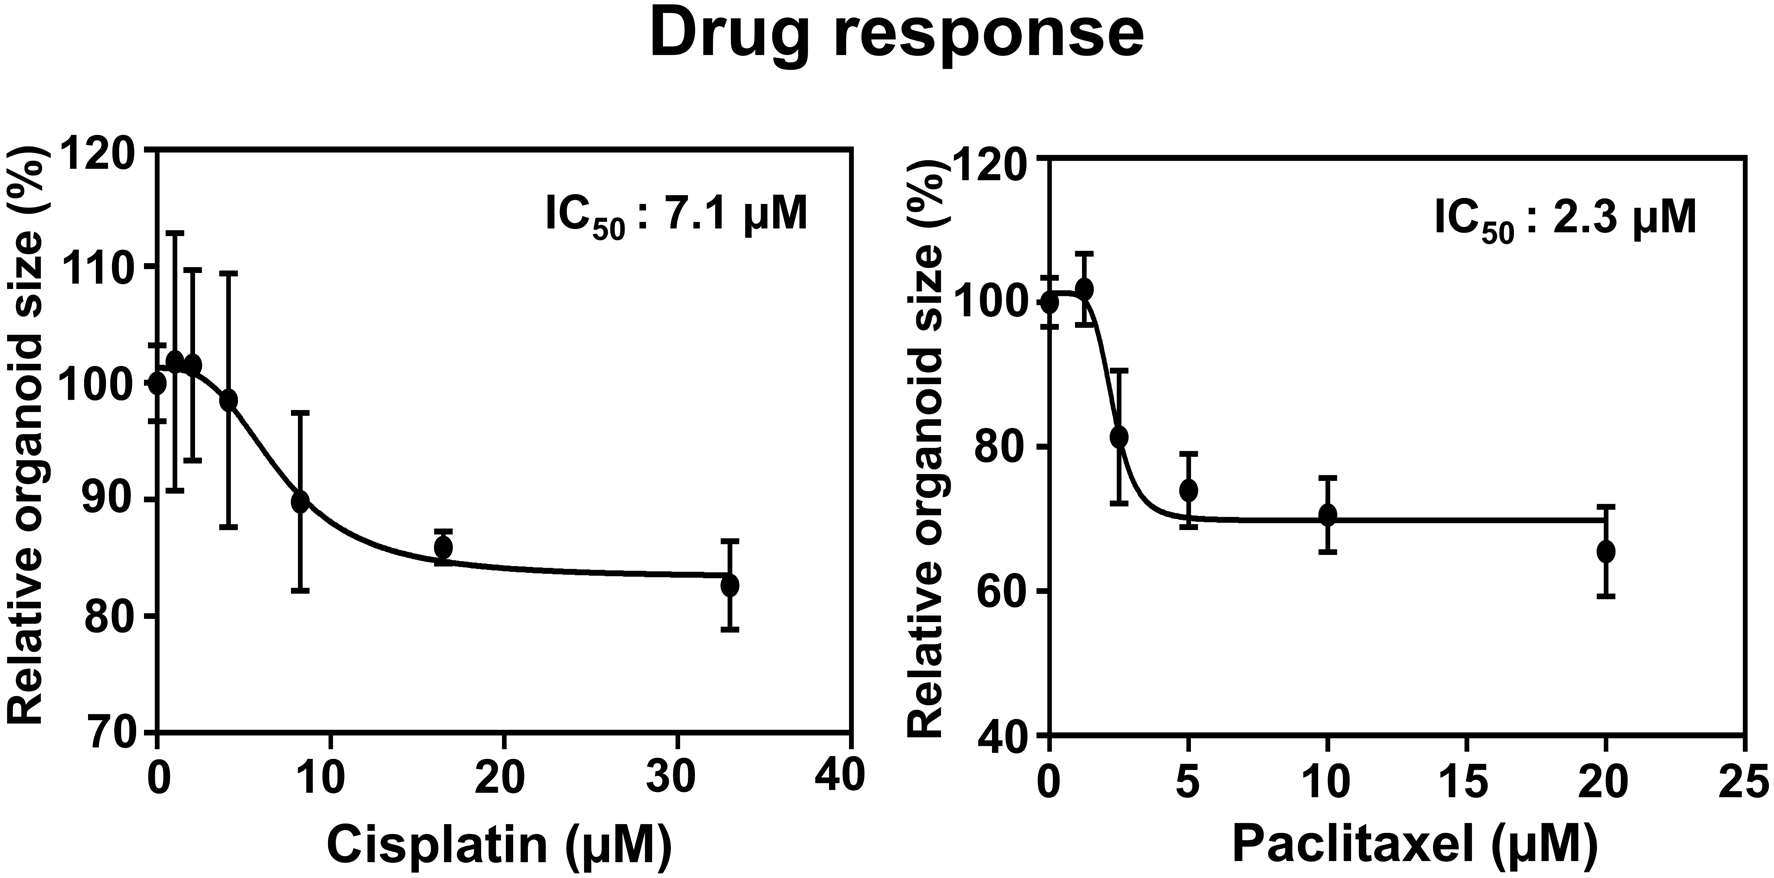
Figure 3. IC50 curve from drug-treated PDO.

EAC PDO size were evaluated by Celigo Imaging Cytometer measuring the mean organoid size following 72 h-exposure to Cisplatin and Paclitaxel at indicated final concentrations. Organoid size was normalized by vehicle-treated control as 100%. IC50 for Cisplatin and Paclitaxel was determined as 7.1 and 2.3 μM (with R squares of 0.5874 and 0.8652), respectively.
