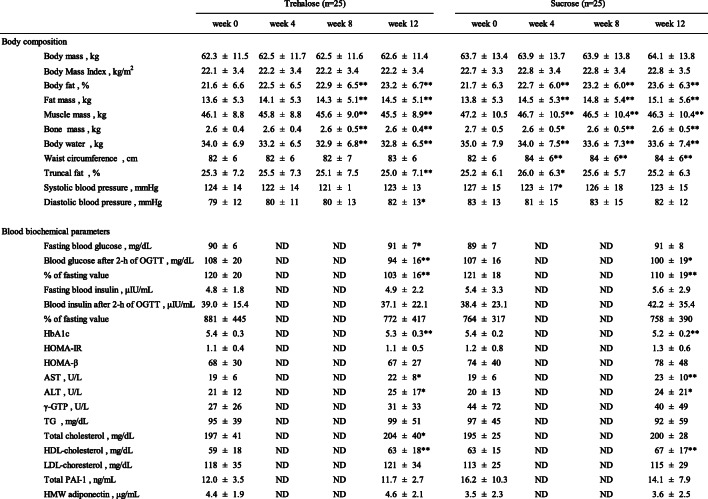
Table 2.
Body composition and blood biochemical parameters in the participants
HOMA-IR homeostasis model assessment-insulin resistance; HOMA-β homeostasis model assessment-beta cell function; AST aspartate transaminase; ALT alanine transaminase; γ-GTP gamma-glutamyl transpeptidase; TG triglyceride; PAI-1 plasminogen activator-inhibitor-1; HMW adiponectin high-molecular weight adiponectin
Data are expressed as mean ± SD (n = 25). Comparisons between two groups in the same week were made using the Mann-Whitney U-test, and week 0 values and week 4, 8, and 12 values were compared using the Wilcoxon signed-rank test. P value: * < 0.05, ** < 0.01 vs. the week 0 value

