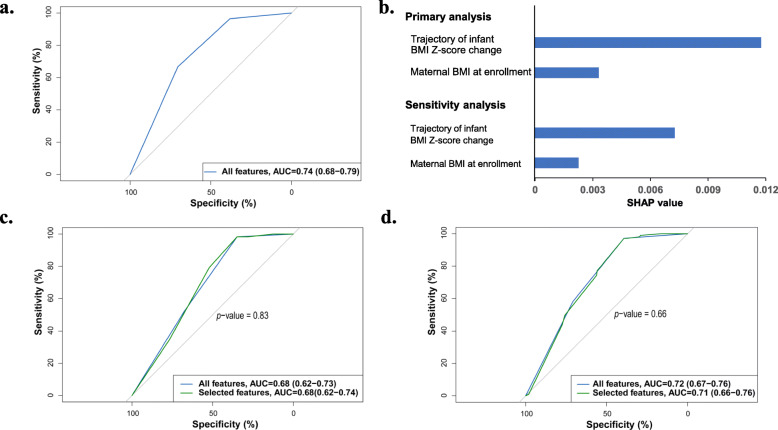
Fig. 2.
Machine learning-identified features effectively predict future childhood overweight/obesity. a Receiver operating characteristic curves (ROC curves) of the predictive models based on all input features in the validation cohort (n = 381). b The average impact of individual features on childhood overweight/obesity risk. We took the mean absolute value of SHAP values for the selected features to get their average impact on predicting childhood overweight/obesity. c Comparison of the performance of the predictive model based on all features with that based on selected features only in the test cohort (n = 382). d Comparison of the performance of the predictive model based on all features with that based on selected features only in the sensitivity analysis (childhood overweight/obesity defined according to criteria based on data derived from Chinese children)

