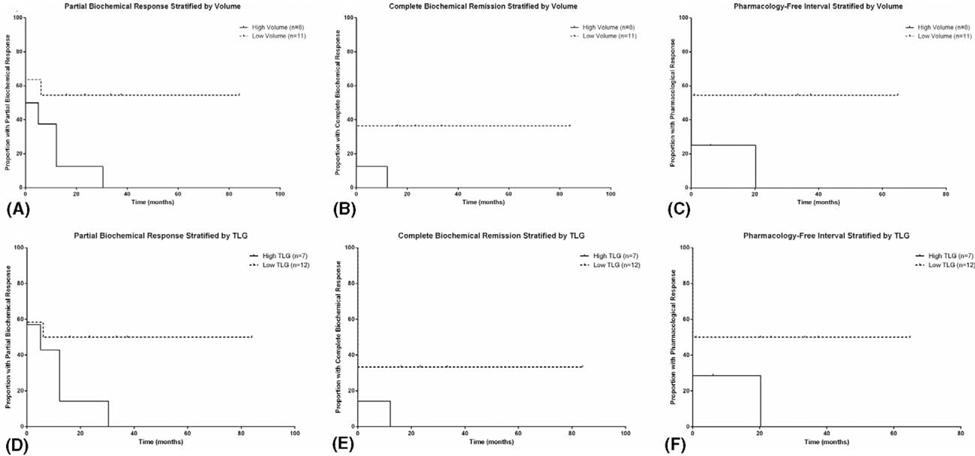
FIGURE 2.
MTV and TLG and response to treatment in patients with metastatic PCCs/PGLs. Partial biochemical response (P < 0.05) (A), complete biochemical remission (P = 0.07) (B), and pharmacology-free interval (P = 0.06) (C) stratified by MTV cutoff of 37.2 mL. Partial biochemical response (P = 0.09) (D), complete biochemical remission (P = 0.11) (E), and pharmacology-free interval (P = 0.12) (F) stratified by TLG cutoff of 190.8 SUVlbm*mL.

