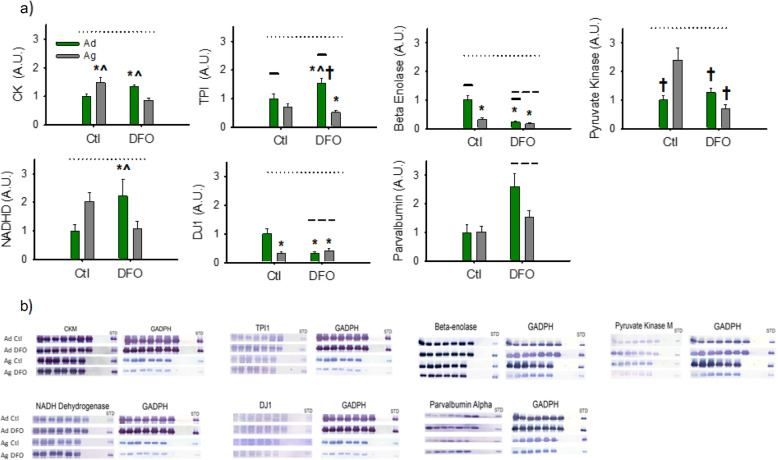
Fig. 3.
a) Mean (Ad, n = 14 (7 Ctl, 7 FO); Ag, n = 12 (6 Ctl, 6 FO), ± SE) protein abundance (arbitrary units, A.U.), normalized to Adult Ctl diet group, by Western blot for CK, TPI, Beta Enolase, PK, NADHD, DJ1 and Parvalbumin. Solid line = Significant main effect of age; Dashed line = Significant main effect of diet; Dotted Line = Significant age X diet interaction; * = significantly different from Ad Ctl group; ^ = Significantly different from Ag FO group; † = Significantly different from Ag Ctl Group. b) Representative immunoblots with the identical standard for corresponding proteins in A along with the corresponding GAPDH loading blots

