
Fig. 2.
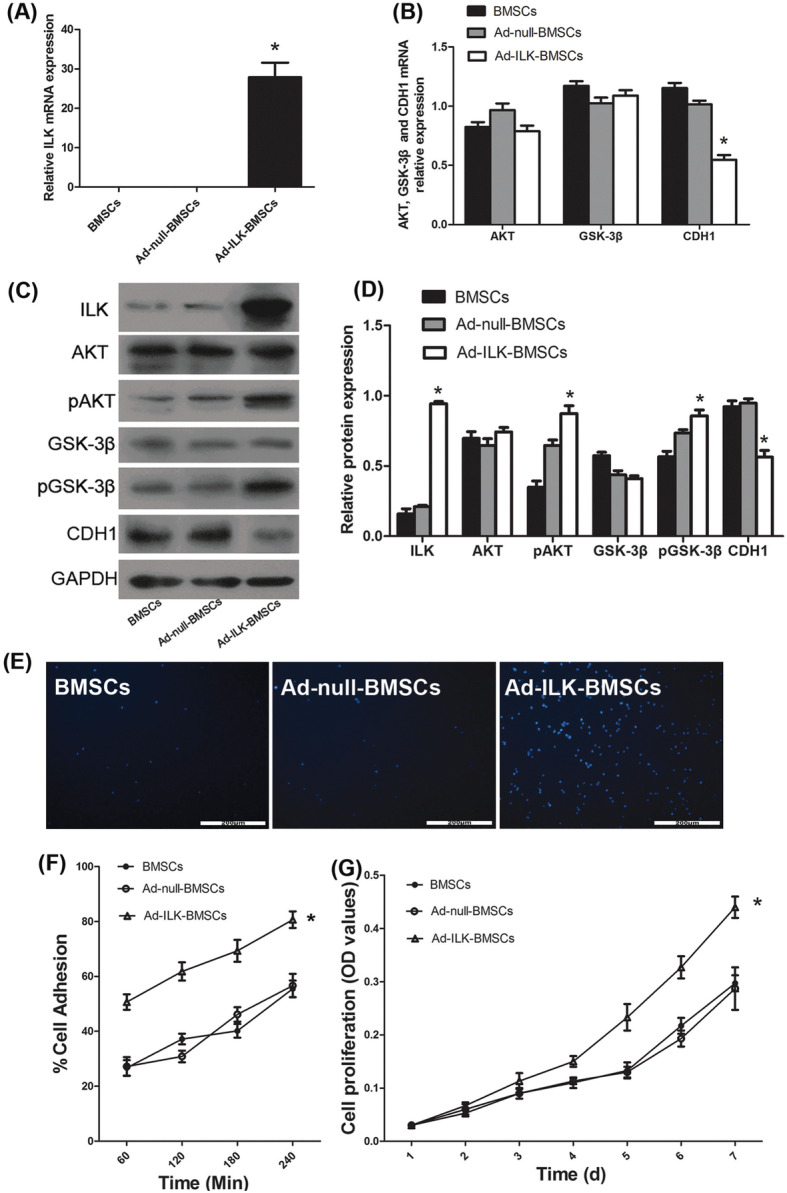
Overexpression of ILK on BMSCs and its effect on proliferation and adhesion of BMSCs. a The mRNA expression of ILK was determined using qRT-PCR. *P < 0.05 versus BMSCs and Ad-null-BMSC group. b The mRNA expression of ILK downstream protein AKT, GSK-3β, and CDH1 was determined using qRT-PCR. *P < 0.05 versus BMSCs and Ad-null-BMSC group. c The protein expression of ILK and its downstream protein AKT, pAKT, GSK-3β, pGSK-3β, and CDH1 by western blot in the BMSCs. d A statistical chart of the relative optical density of ILK, AKT, pAKT, GSK-3β, pGSK-3β, and CDH1 in each group. *P < 0.05 versus BMSCs and Ad-null-BMSC group. e Adherent cells stained with Hoechst were observed using a Fluoview microscope in cell adhesion assay. f A statistical chart reveals the percentage of adherent cells by the total corrected fluorescence of the total cells in each group. *P < 0.05 versus BMSCs and Ad-null-BMSC group. g The proliferation level of cells in each group was determined using CCK-8 assay for 7 days. *P < 0.05 versus BMSCs and Ad-null-BMSC group