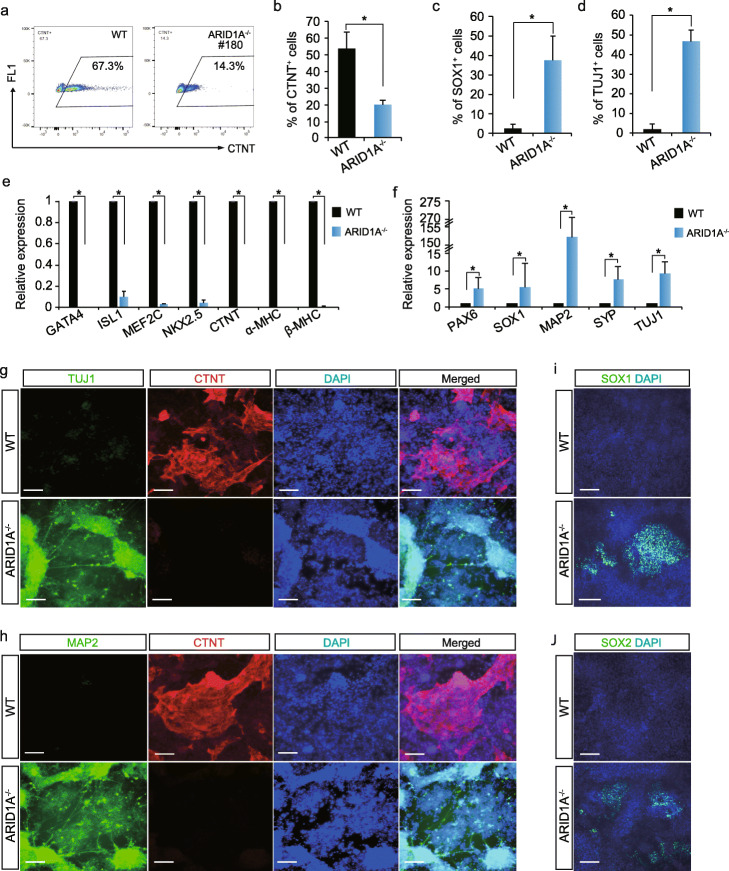
Fig. 4.
Characterization of WT and ARID1A−/− hESC-derived cells. a, b Flow cytometry quantification of the ratios of CTNT+ CMs derived from WT and ARID1A−/− cells after 10 days cardiac differentiation. All bars are shown as mean ± SD. n = 3, *p < 0.05 (an unpaired two-tailed t test). c, d Detecting ratios of SOX1+ (c) and TUJ1+ (d) cells in WT and ARID1A−/− hESC-derived cells by immunostaining. All bars are shown as mean ± SD. n = 3, *p < 0.05 (an unpaired two-tailed t test). e, f Comparing the expression levels of cardiac markers (e) and neural markers (f) in WT and ARID1A−/− hESC-derived cells by qRT-PCR. All bars are shown as mean ± SD. n = 3, *p < 0.05 (KO vs. WT for each gene, an unpaired two-tailed t test). g, h Immunostaining of neuron markers TUJ1 (g) and MAP2 (h) and cardiomyocyte marker CTNT (g, h) in WT and ARID1A−/− hESC-derived cells after 10 days cardiac differentiation. Nuclei were labeled by DAPI. Scale bar, 100 μm. i, j Immunostaining of neural stem cell markers SOX1 (i) and SOX2 (j) in WT and ARID1A−/− hESC-derived cells. Nuclei were labeled by DAPI. Scale bar, 100 μm

