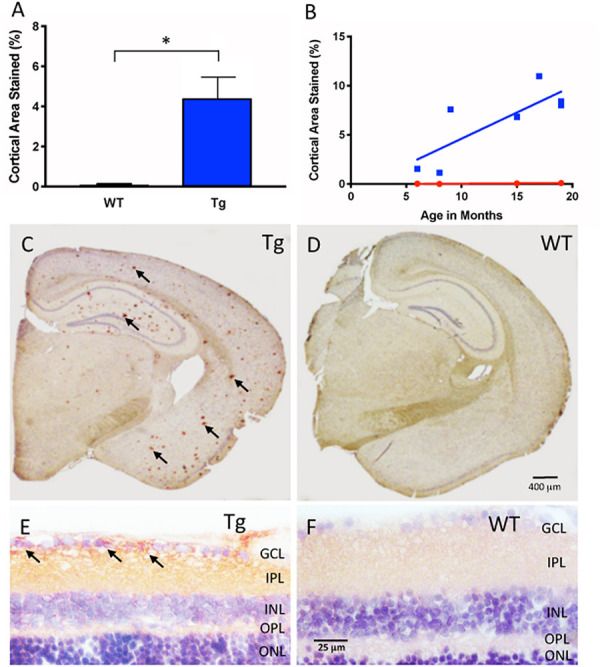
FIGURE 1.

Aβ immunohistochemical cortical 6E10 immunostaining. (A) Tg mice (blue) had significantly higher percentage of cortical area immunostained relative to their WT controls (red) (Tg: 4.44% ± 1.50, N = 7; WT: 0.15% ± 0.08, N = 4; p < 0.05; Two-tailed Mann Whitney U test). (B) There was a trend towards higher cortical immunostaining in Tg mice (blue) that begins at nine months of age. There was a moderately strong correlation and increase of immunostaining over time for Tg mice (r2 = 0.639, slope = 0.53 ± 0.18, but not WT mice r2 = 0.85, slope = 0.006 ± 0.002; p = 0.77). (C) Representative cross-section of an 18 month Tg mouse brain immunoreacted for Aβ. Note the numerous Aβ plaques shown by the red (AEC) chromogenic reaction product in cortex and hippocampal areas (arrows), compared to (D), the age-matched WT brain immunoreacted for Aβ. Scale bar for (C,D) is shown in D = 400 microns. (E) Retinal cross-section of an 18 month Tg mouse eye demonstrating Aβ immunoreactivity (arrows) in the inner retina in the ganglion cell layer (GCL) and the inner plexiform layer (IPL) compared to (F) the age-matched WT retina, which demonstrates a pale pink baseline level of immunoreactivity. Scale bar in D = 400 microns. Scale bar for (E,F) is shown in F = 25 microns. *Denotes significance.
