
FIGURE 5.
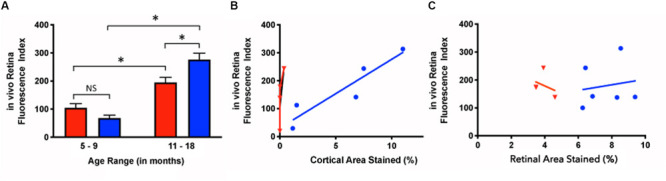
In vivo retinal fluorescence in Tg and WT retina in younger and older mice. (A) In vivo retinal fluorescence was similar between younger Tg (blue) and WT (red) mice (Tg: 68.1 ± 56.7, N = 18; WT: 104.7 ± 62.8, N = 8; p > 0.05). With increasing age, the amount of retinal fluorescence increased significantly for both Tg (younger Tg: 68.1 ± 56.7, N = 18; older Tg: 276.5 ± 108.6, N = 29; p < 0.05) and WT groups (younger WT: 104.7 ± 62.8, N = 8; older WT: 194.8 ± 52.5, N = 22; p < 0.05). However, within the older group (11–18 months), the Tg mice had significantly greater retinal fluorescence than the WT mice (Tg: 276.5 ± 108.6, N = 29; WT: 194.8 ± 52.5, N = 22; p < 0.05) Statistics in A was undertaken with a two-way ANOVA multiple comparisons with post hoc Bonferroni correction. (B) The correlation between in vivo retinal fluorescence and ex vivo cortical immunoreactivity was stronger in Tg (blue) compared to WT (red) mice (Tg: r2 = 0.859, slope = 24.6 ± 5.75, N = 5, p < 0.05; WT: r2 = 0.522, slope = 370 ± 250, N = 4, p = 0.28). (C) When comparing in vivo fluorescence and ex vivo retinal immunolabeling, Tg (blue) had a weak positive correlation (r2 = 0.0251, slope = 10.0 ± 31.1, N = 6, p = 0.76) while WT (red) had a weak negative correlation (r2 = 0.107, slope = -27.1 ± 55.3, N = 3, p = 0.67). *Denotes significance.