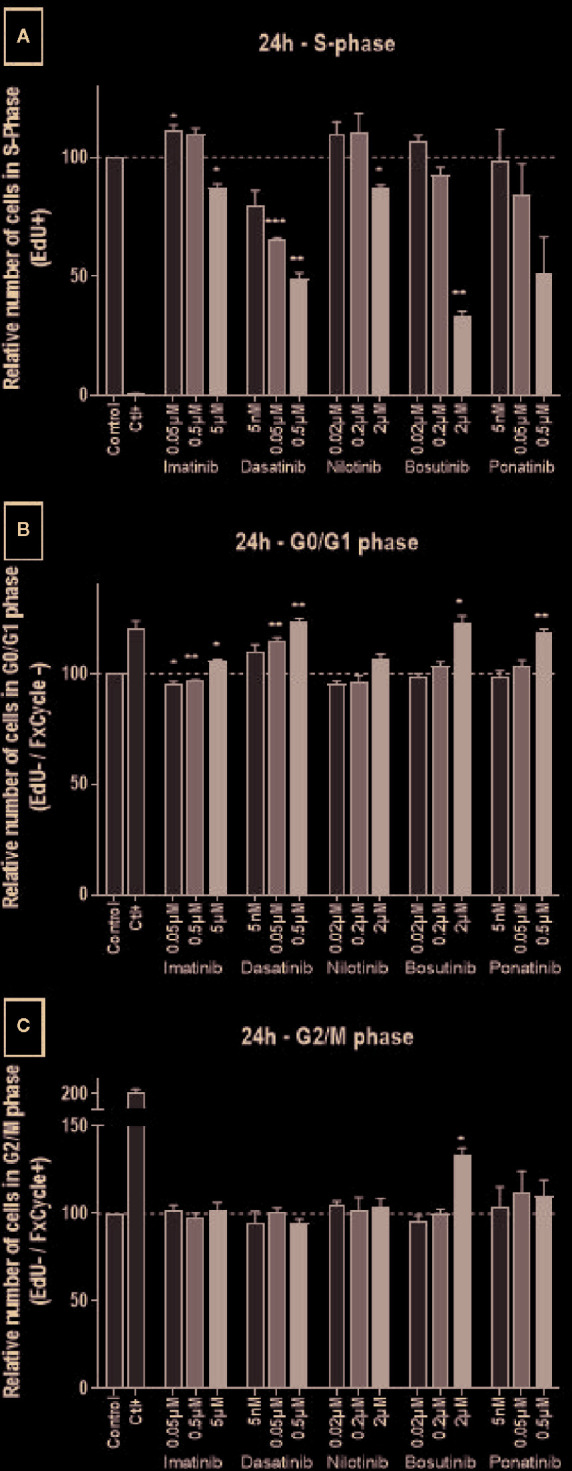
Figure 3.

All BCR-ABL TKIs inhibit HUVEC proliferation. Cell cycle analysis was performed on HUVECs exposed to BCR-ABL TKIs for 24 h in medium with 10% dialyzed FBS by measuring EdU incorporation and DNA content (FxCycle). Histograms represent cells in S-phase (A), G0/G1 phase (B), and G2/M phase (C). Bars represent the means of the three experiments ± SEM. Three concentrations were tested for each TKI. Results are expressed relative to control (DMSO 0.2%). Differences between conditions were tested using a one sample t-test that compared each TKI condition versus control. *p < 0.05 and **p < 0.01.
