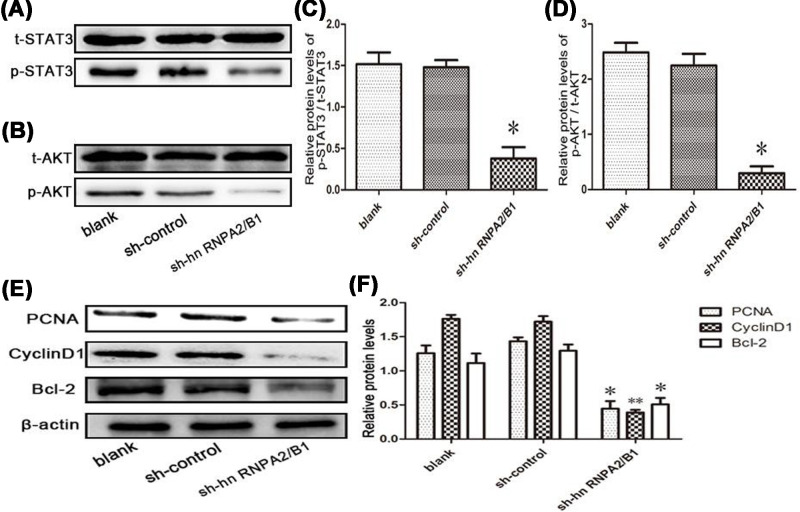
Figure 5. Knockdown of hnRNPA2/B1 inhibits AKT and STAT3 signaling in glioma cells.
(A–D) Western blot analysis of AKT and STAT3 phosphorylation levels (*PC = 0.0317, <0.05; *PD = 0.0142, <0.05 vs control, analyzed by t test). (E,F) Analysis of PCNA, Cyclin D1 and Bcl-2 expression by knockdown of hnRNPA2/B1 in U251 cells. Data were based on at least three independent experiments and are shown as the mean ± SD (*P=0.0209, <0.05; **P=0.0082, <0.01 vs control, analyzed by t test).

