Figure 4.
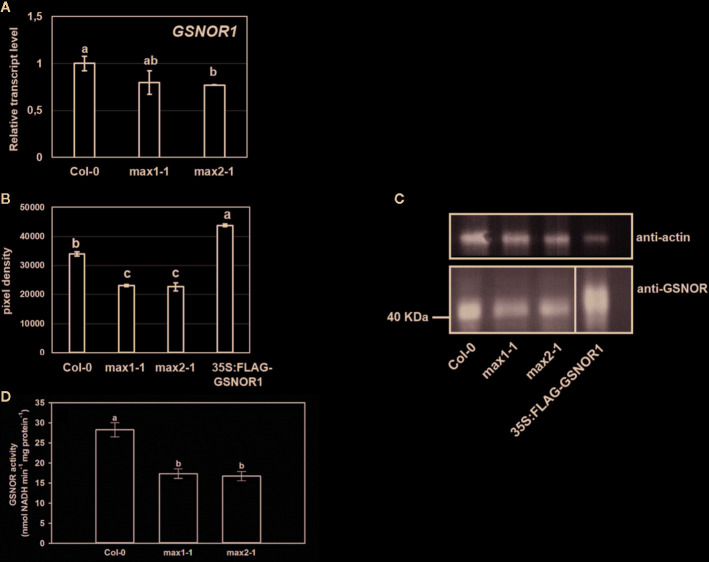
Relative transcript level (A) of GSNOR1 in Col-0, max1-1 and max2-1 seedlings. (B, C) Protein abundance of GSNOR in max mutants and 35S:FLAG-GSNOR1 (as a positive control). Anti-actin was used as a loading control. (D) GSNOR activity (nmol NADH min−1 mg protein−1) in Col-0, max1-1 and max2-1 seedlings. Different letters indicate significant differences according to Duncan's test (n = 3 or 5, P ≤ 0.05).

