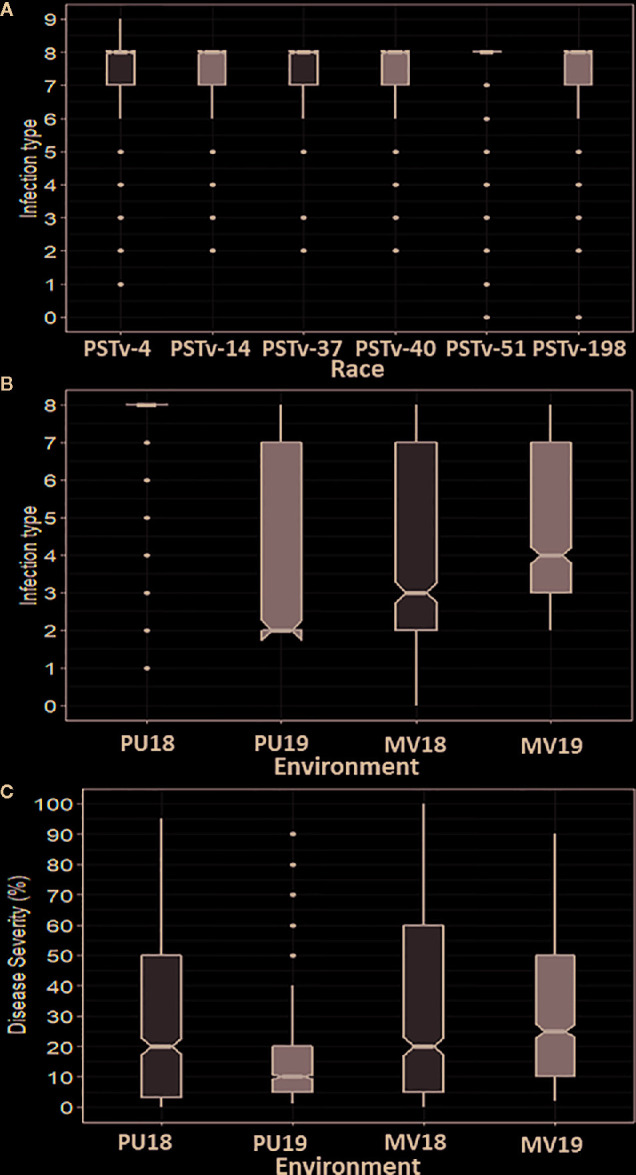
Figure 1.

Distributions of stripe rust infection type (IT) and disease severity (DS). (A) IT distributions in the seedling tests with different races of Puccinia striiformis f. sp. tritici. (B) IT distribution across field environments including Pullman 2018 (Pu18), Mount Vernon 2018 (MV18), Pullman 2019 (Pu19), and Mount Vernon 2019 (MV19). (C) DS distribution across field environments. Solid horizontal lines display the median values. Notches display a 95% confidence interval around the median. Top and bottom box edges display the first and third quartile values, respectively. Whiskers display the largest and smallest values within 1.5 times the interquartile range. Dots represent the values out of 1.5 times the interquartile range.
