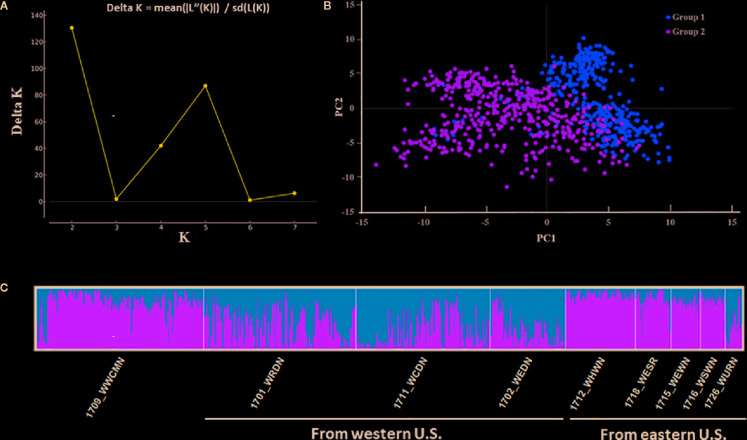
Figure 2.
Model-based population structure of the 857 winter wheat accessions combined with markers. (A) The result obtained from Structure Harvester analysis (k = 2). (B) The STRUCTURE analysis showed two hypothetical subpopulations represented by different colors. (C) First two components (PC1 and PC2) of a principal component analysis.

