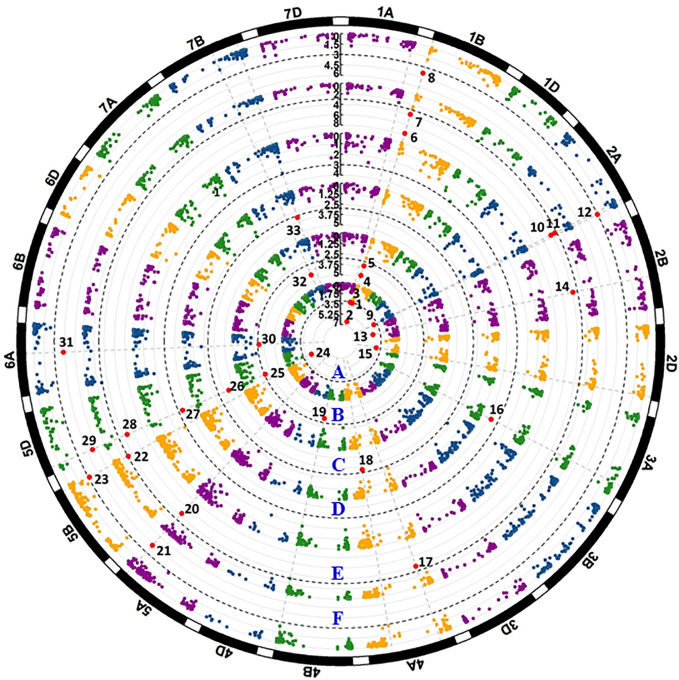
Figure 4.
Manhattan plots of significant p values for markers associated with all-stage resistance to stripe rust. The black dash line shows the threshold -log10(p) value of 3. Each circular represents one seedling test with race PSTv-4 (A), PSTv-14 (B), PSTv-37 (C), PSTv-40 (D), PSTv-51(E), and PSTv-198 (F). Significant markers are enlarged in red dots and numbered.

