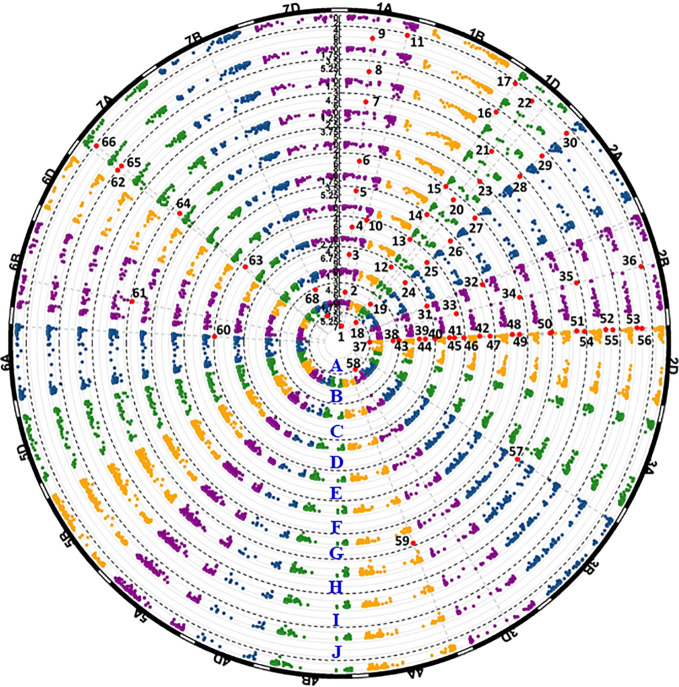
Figure 5.
Manhattan plots of significant p values for markers associated with stripe rust resistance detected in the field experiments. The black dash lines show the threshold -log10(p) value of 3. Each circular represents one field data set of Pullman 2018 IT data (A), Pullman 2018 DS data (B), Mount Vernon 2018 IT data (C), Mount Vernon 2018 DS data (D), Pullman 2019 IT data (E), Pullman 2019 DS data (F), Mount Vernon 2019 IT data (G), Mount Vernon 2019 DS data (H), BLUE-ALL-IT data (I), and BLUE-ALL-DS data (J). Significant markers are enlarged in red dots and numbered.

