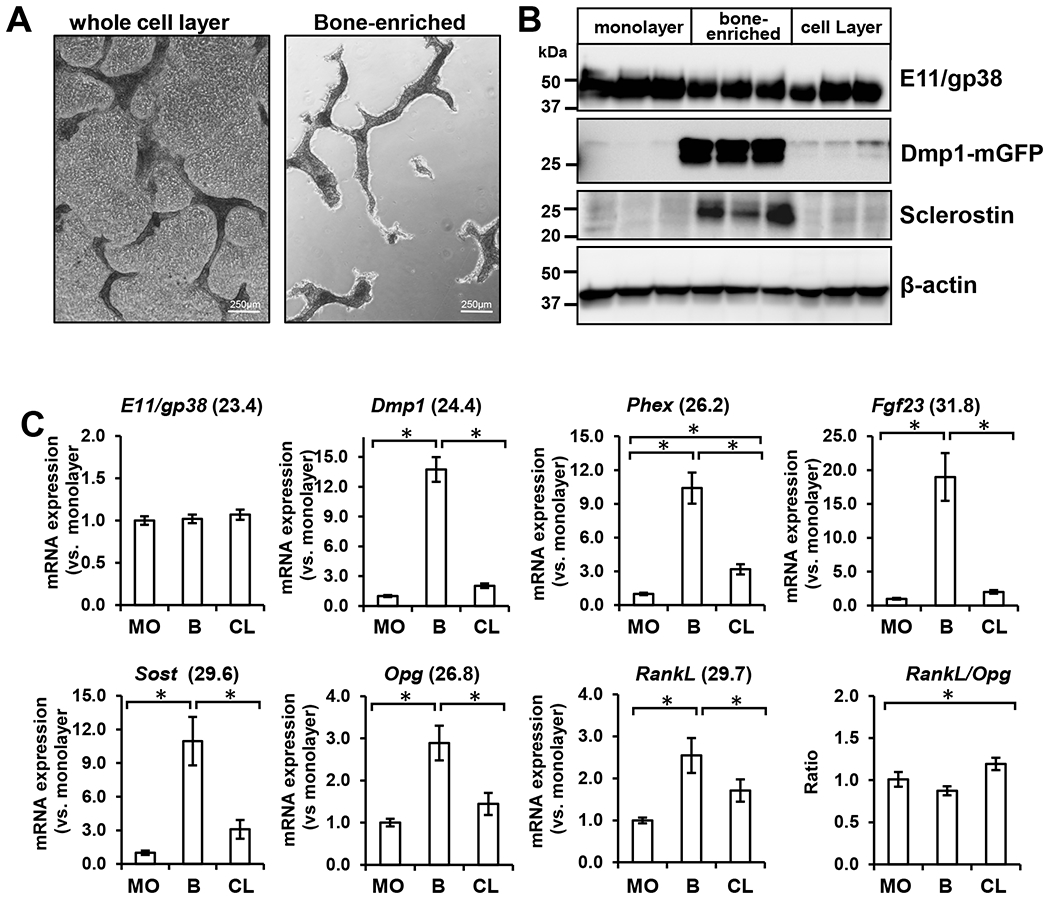
Figure 7: Enrichment for osteocyte marker protein and gene expression in OmGFP66 bone-like structures.

A) Phase contrast micrographs of OmGFP66 cell cultures before (whole cell layer) and after enrichment for bone-like structures (bone-enriched), bar = 250μm. B) Western blotting of lysates from the OmGFP66 monolayer and bone-enriched fractions compared to the whole cell layer. Note that E11/gp38 is equally expressed in all three fractions but that Dmp1-mGFP and sclerostin are highly enriched in the bone-enriched fraction compared to the monolayer and whole cell lysate. C) qPCR analysis showing expression of osteocyte marker genes, E11/gp38, Dmp1, Phex, Fgf23, Sost, Opg, and RankL by OmGFP66 cells in the monolayer (MO) and bone-enriched fraction (B) compared to the whole cell layer (CL). Data were normalized to β-actin as a housekeeping control and are presented as the fold change compared to the monolayer fraction. (mean ± SEM, n=3; * = p≤ 0.05, ANOVA/Tukey’s). Numbers in parentheses are the Ct values for the highest level of expression of each gene.
