
Figure 3.
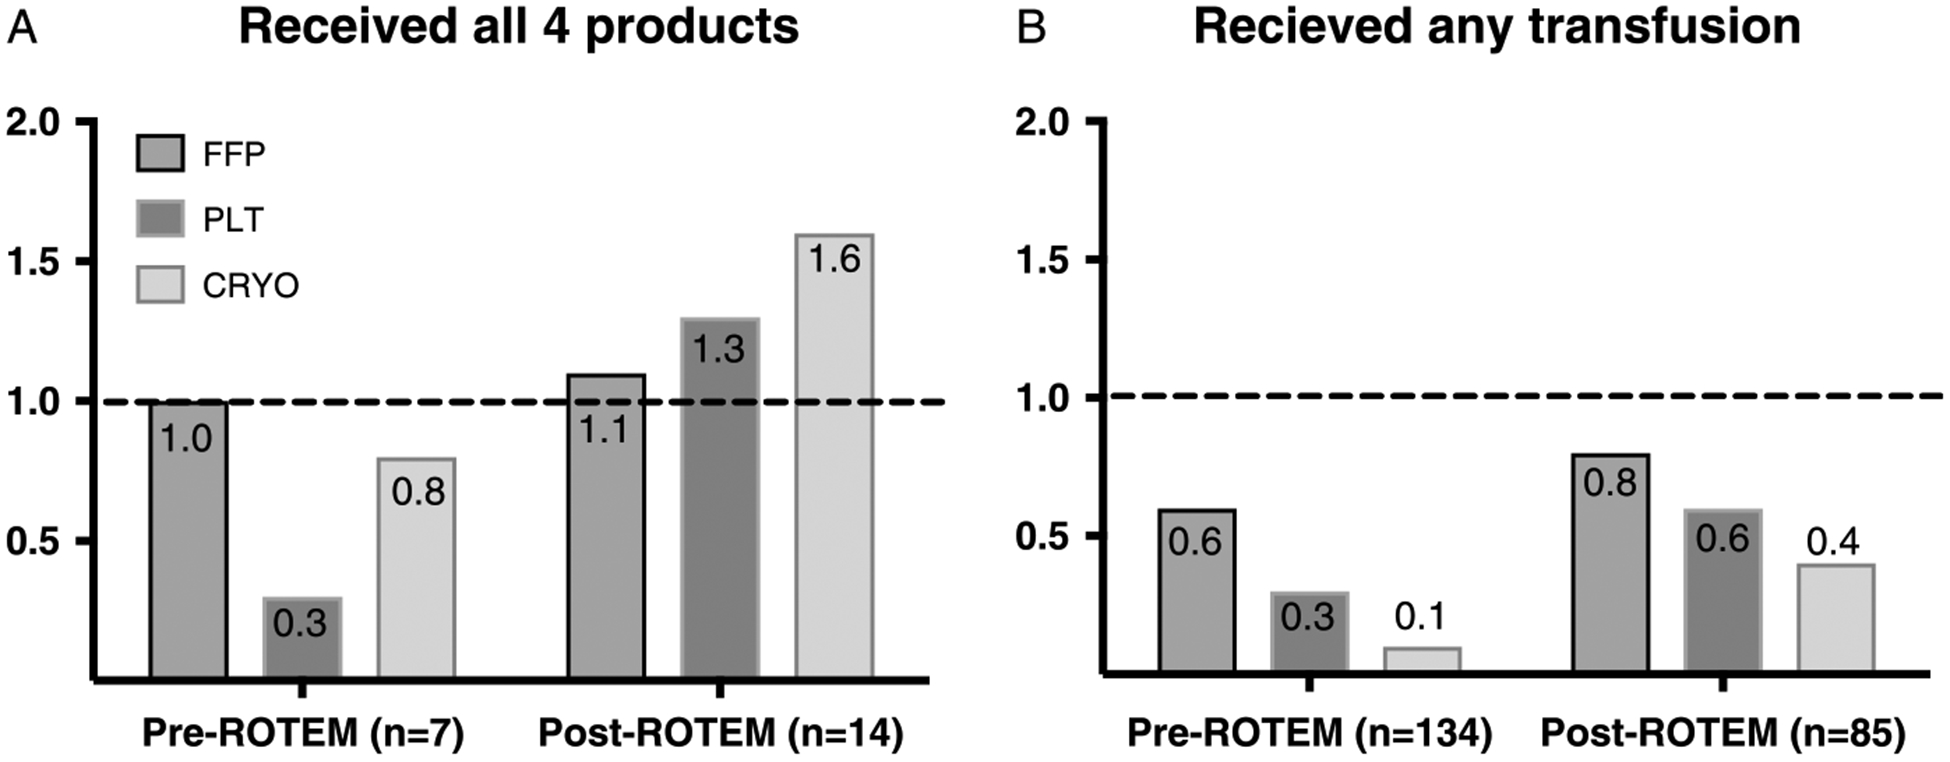
Transfusion ratios in the pre- and post-ROTEM periods. A, A graphical representation of FFP:pRBC, PLT:pRBC, and FFP:pRBC ratios for patients who received all four blood products (n = 7, pre-ROTEM and n = 14, post-ROTEM). B, A graphical representation of FFP:pRBC, PLT:pRBC, and FFP:pRBC ratios for all trauma patients.