
FIGURE 5.
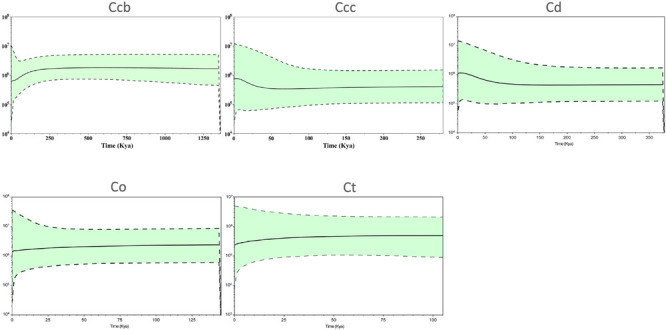
Bayesian skyline plot analysis for the effective population size over time for C. chinensis var. brevisepala (Ccb), C. chinensis var. chinensis (Ccc), C. deltoidea (Cd), C. omeiensis (Co), and C. teeta (Ct) species based on the cpDNA. The gray dash lines indicate 95 % confidence intervals.