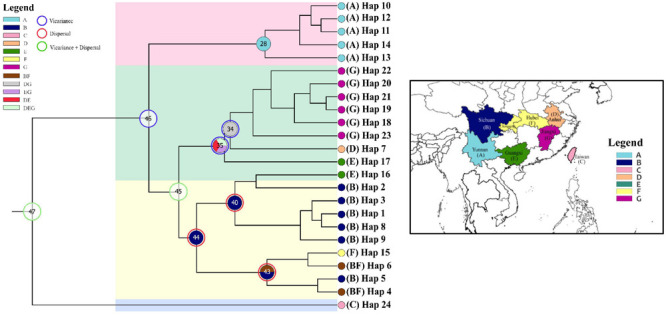
FIGURE 7.

Ancestral distributions reconstructed and dispersal–vicariance analysis generated by RASP from the cpDNA data. Map showing seven geographical regions in colors as defined in RASP analysis. Pie charts on nodes display the relative probabilities of possible ancestral ranges.
