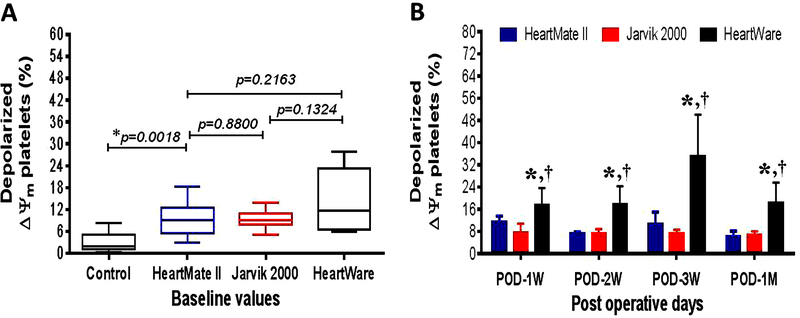
Figure 4.
Comparison of change in % depolarized ΔΨm platelets in controls and before and after implantation with three different kinds of CF-LVADs. (A) Box-whisker plots showing control and baseline values of % depolarized ΔΨm platelets in patients with different CF-LVAD settings. The lines across each box plot represent the median value. The lines that extend from the top and the bottom of each box represent the lowest and highest observations still inside the lower and upper limit of confidence. *p<0.05 is considered significant in Mann-Whitney U test. (B) Change in post-operative levels of % depolarized ΔΨm platelets between different devices specific patients during the study period. Data are expressed as mean±SD. *,p<0.05 compared with HeartMate II and †,p<0.05 compared with Jarvik in Student’s t-test.

