
Figure 2.
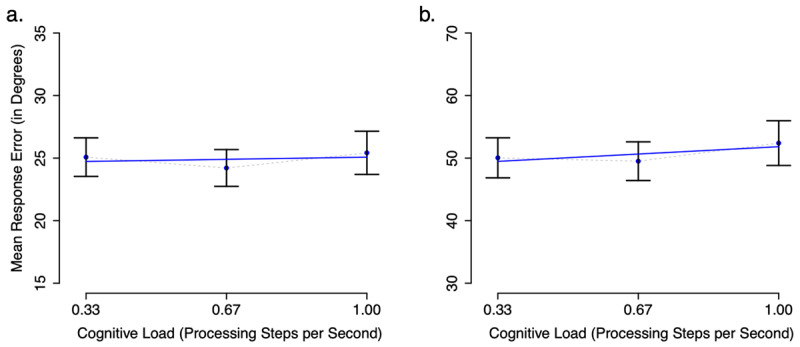
Mean response error in degrees of angle by cognitive load condition (number of digits/6s retention interval) observed in Experiment 1a (continuous memoranda + tone task; panel a) and Experiment 1b (continuous memoranda + parity task; panel b) Error bars represent standard error of the mean. The blue line shows the linear regression of mean response error on cognitive load. Note that the y-axis is compressed in panel a. relative to panel b. due to Experiment 1a having one half the total stimulus range compared to Experiment 1b.