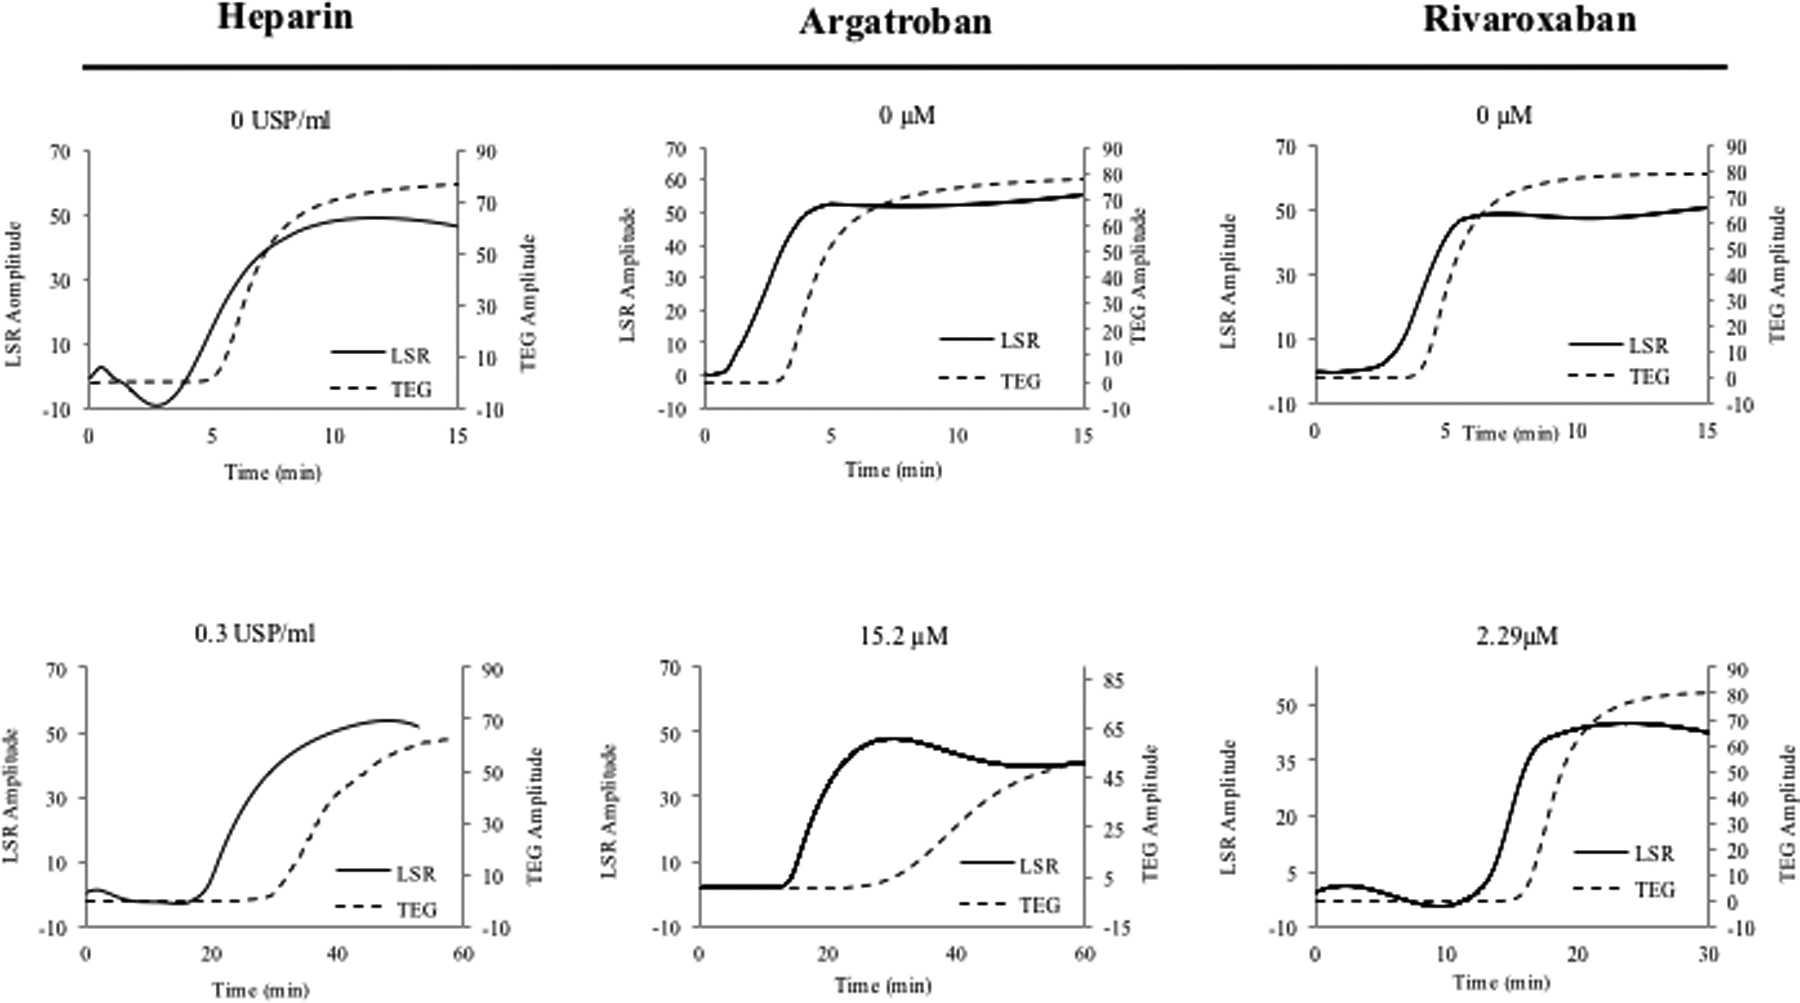
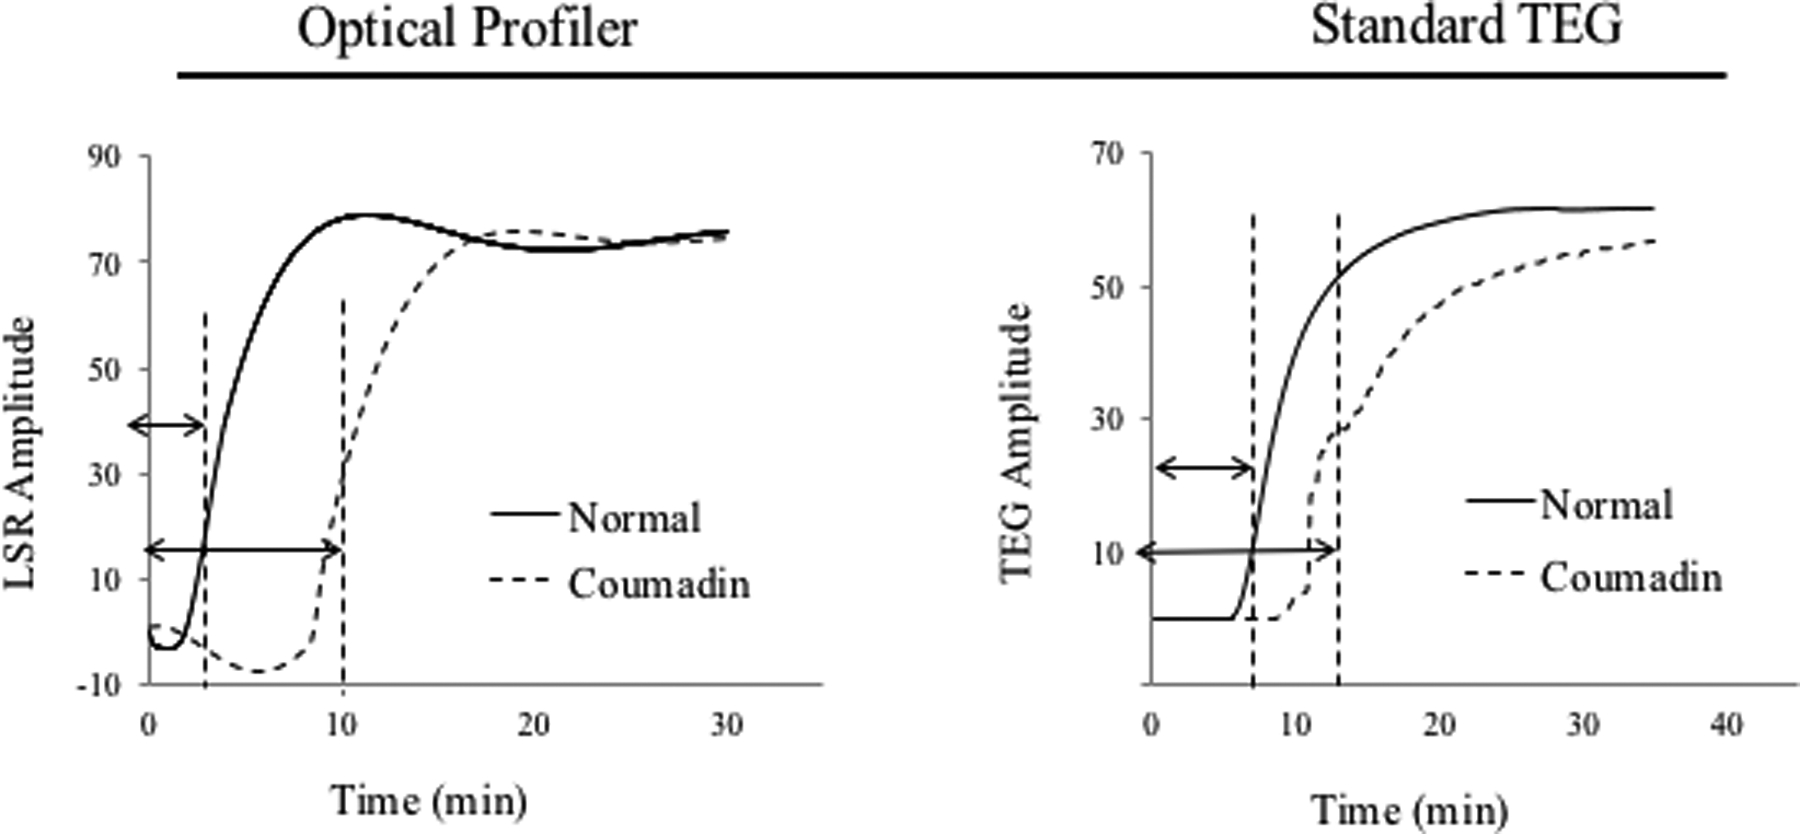
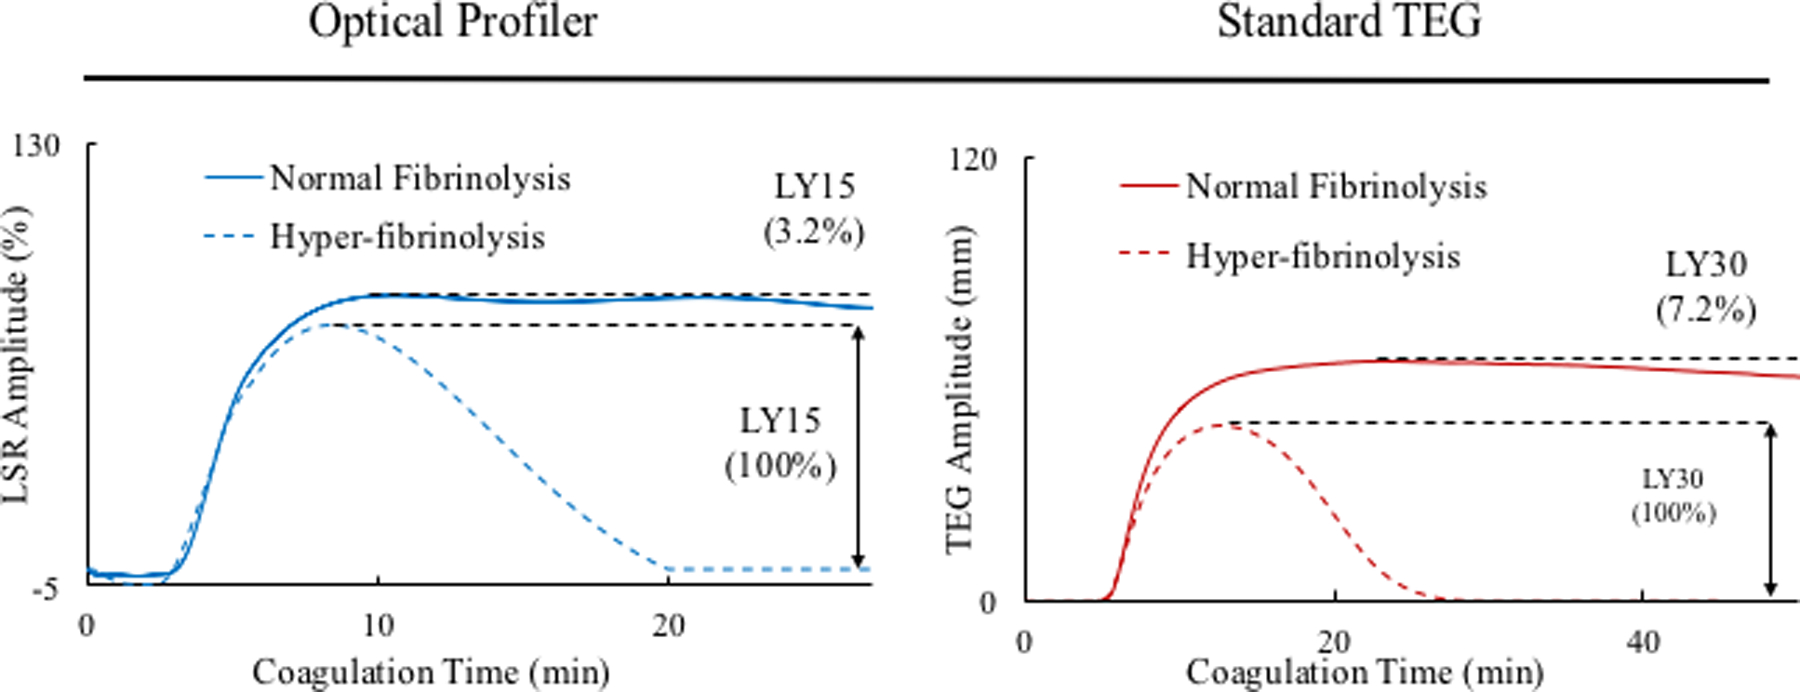
Figure 4:


(A) LSR curves obtained from whole blood samples (swine) show prolonged clotting time for all 3 anticoagulant treatments. (Adapted from Tshikudi et al. PLOS one)32 (B) Warfarin- treated patients have increased clotting time measured by LSR. (Adapted from Tshikudi et al. PLOS One)32 (C) Detecting fibrinolysis using LSR: the dotted line shows the sample spiked with tPA compared with the untreated control (solid line). In all cases, LSR is corroborated by standard TEG.
