
Figure 3:
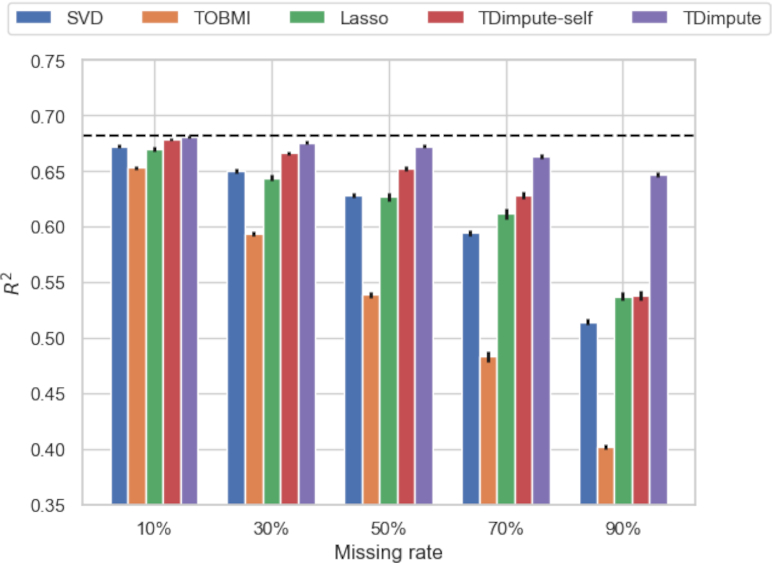
The mean correlations ( ) of the top 100 CpG-gene pairs over 16 cancer datasets by 5 imputed methods. Dashed black line indicates the correlations from the actual dataset. Error bars show the standard error of the mean.
Official websites use .gov
A
.gov website belongs to an official
government organization in the United States.
Secure .gov websites use HTTPS
A lock (
) or https:// means you've safely
connected to the .gov website. Share sensitive
information only on official, secure websites.
The mean correlations () of the top 100 CpG-gene pairs over 16 cancer datasets by 5 imputed methods. Dashed black line indicates the correlations from the actual dataset. Error bars show the standard error of the mean.