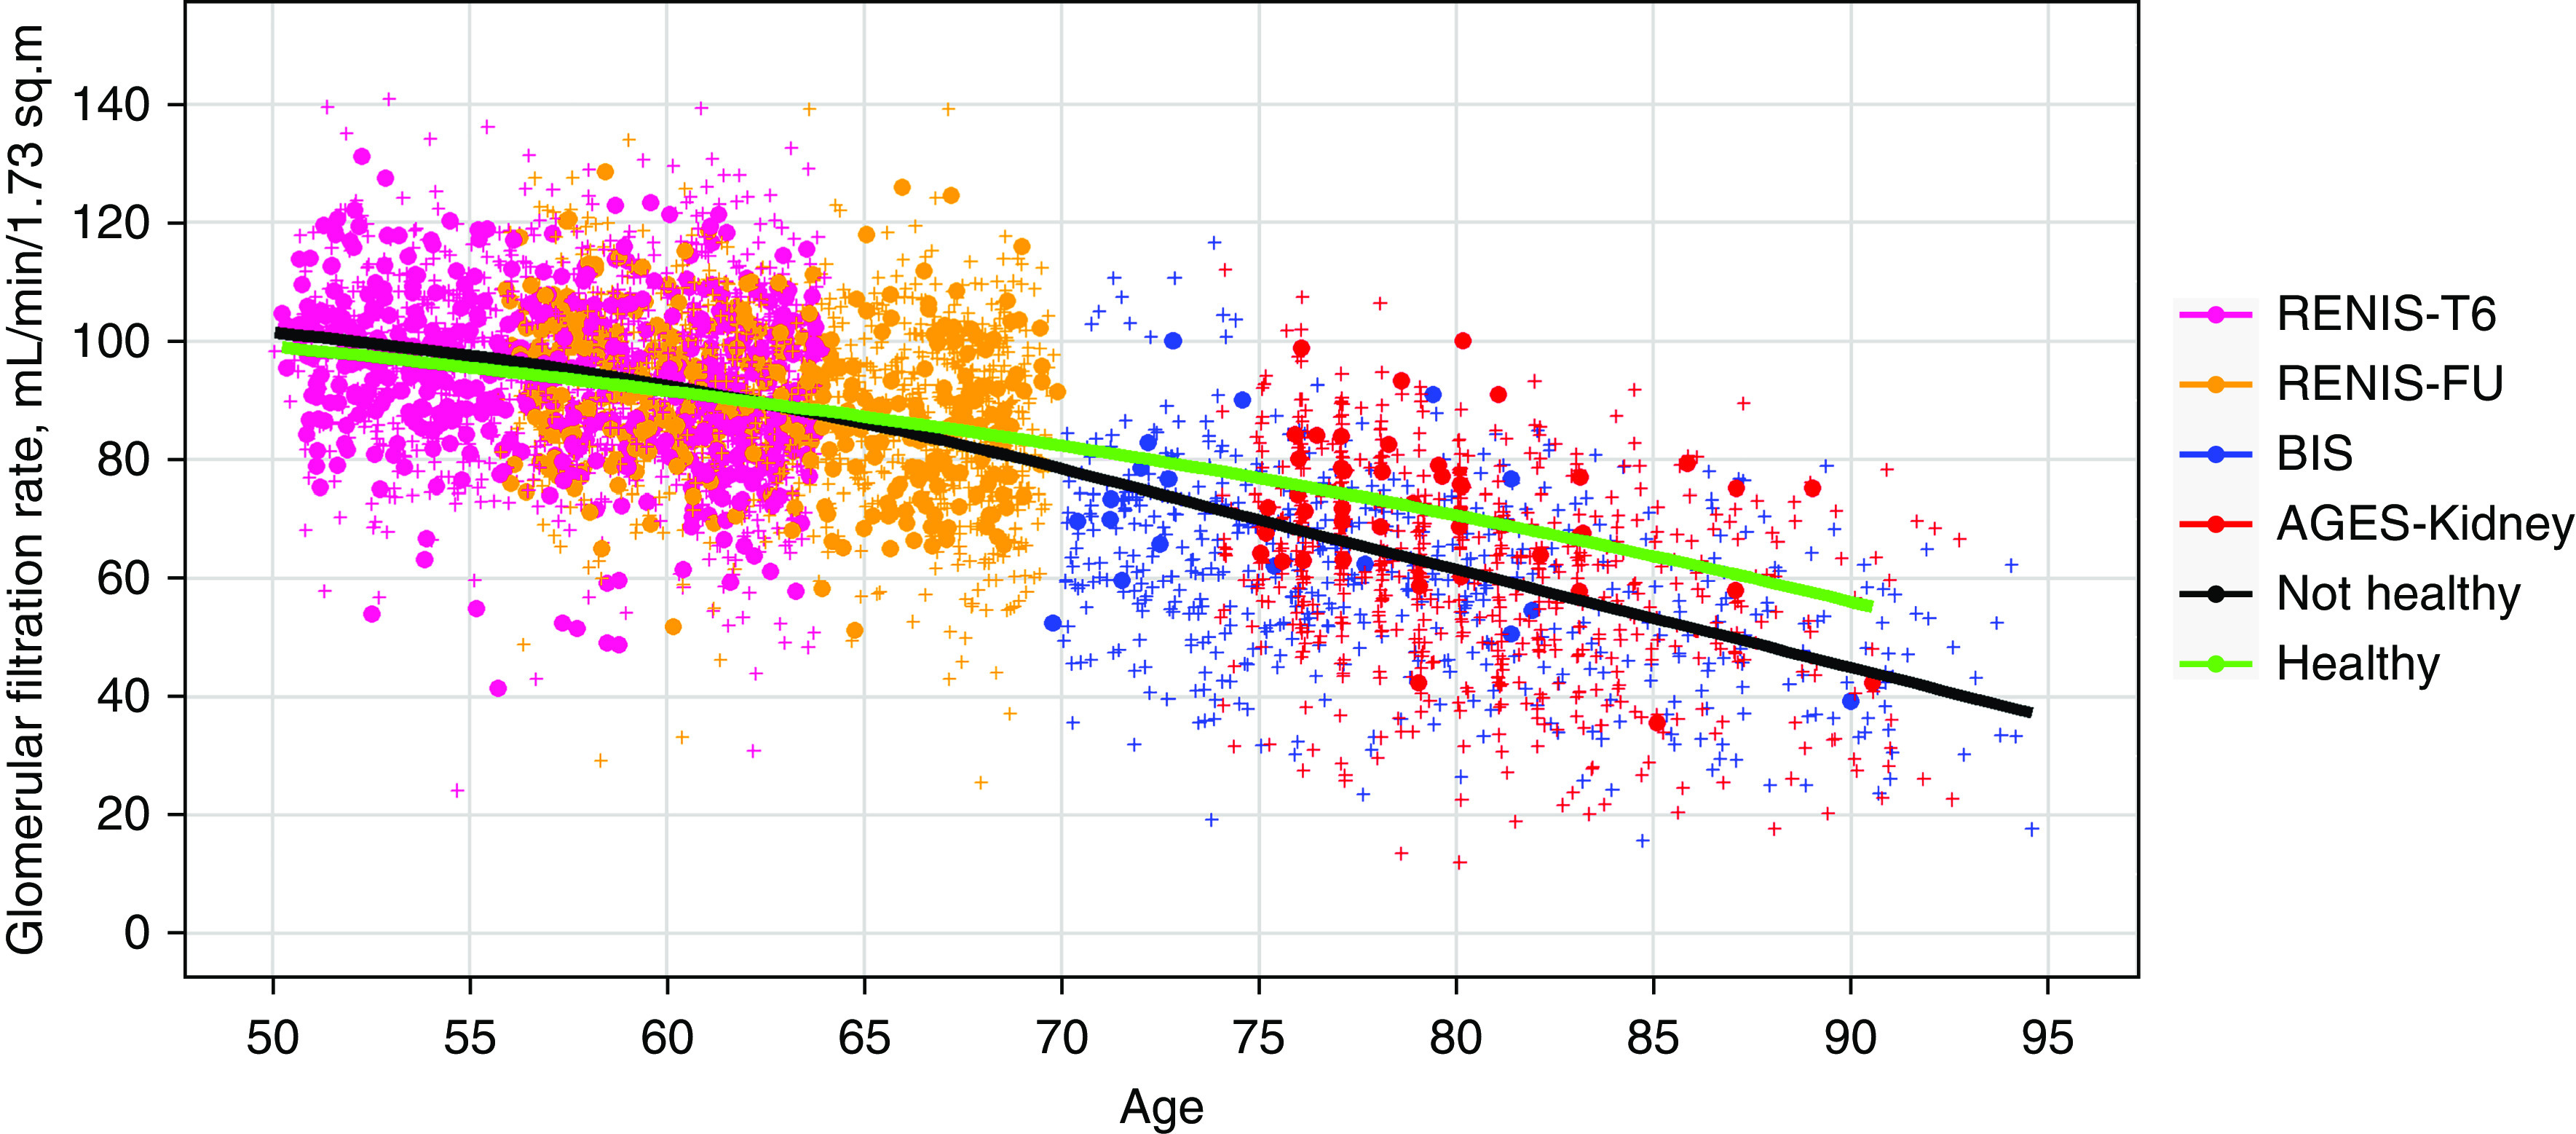
Figure 2.

Unadjusted GFR according to cohort and health status. Body surface area–indexed GFR measured as plasma iohexol clearance and plotted against age in the RENIS, BIS, and AGES-Kidney cohorts (n=4209). The marker colors indicate cohort membership. Filled circles indicate measurements in persons who were healthy and crosses in persons who were unhealthy. Measurements for both the baseline (RENIS-T6) and the follow-up examinations (RENIS-FU) of the same persons in the RENIS cohort are shown. The red and green curves represent unadjusted locally estimated scatterplot smoothing fits to measurements in people who were unhealthy and healthy, respectively.
