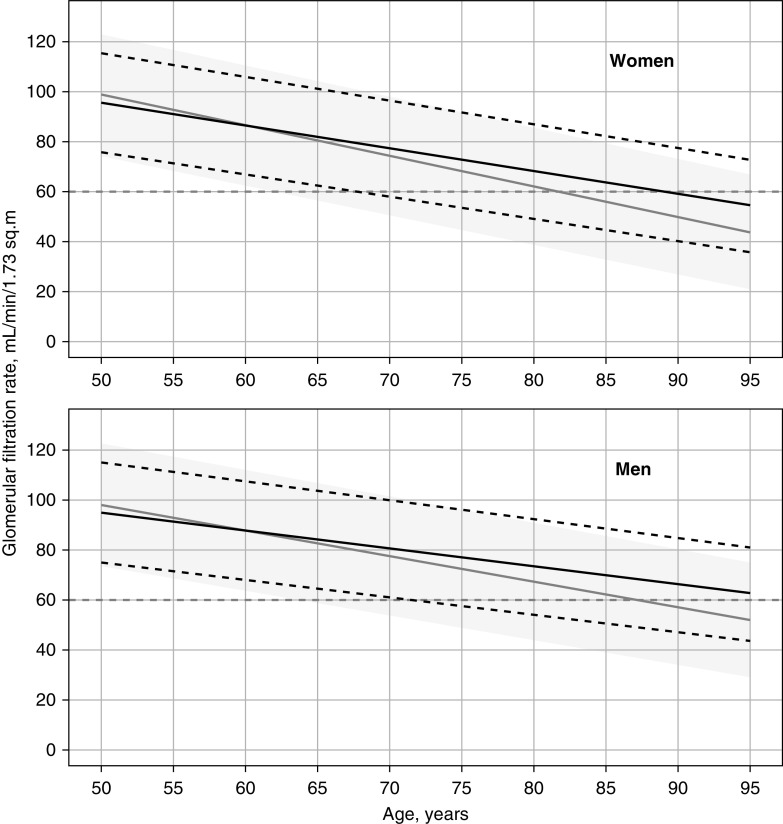
Figure 3.
GFR according to sex and health status. Predicted median (bold black line) and 2.5th and 97.5th percentiles (dashed black lines) as a function of age for healthy women (upper panel) and men (lower panel). The predicted median (gray line) and 95% interpercentile intervals (dark gray band) are shown for persons classified as unhealthy for comparison. The gray dashed line indicates the 60 ml/min per 1.73 m2 level.

