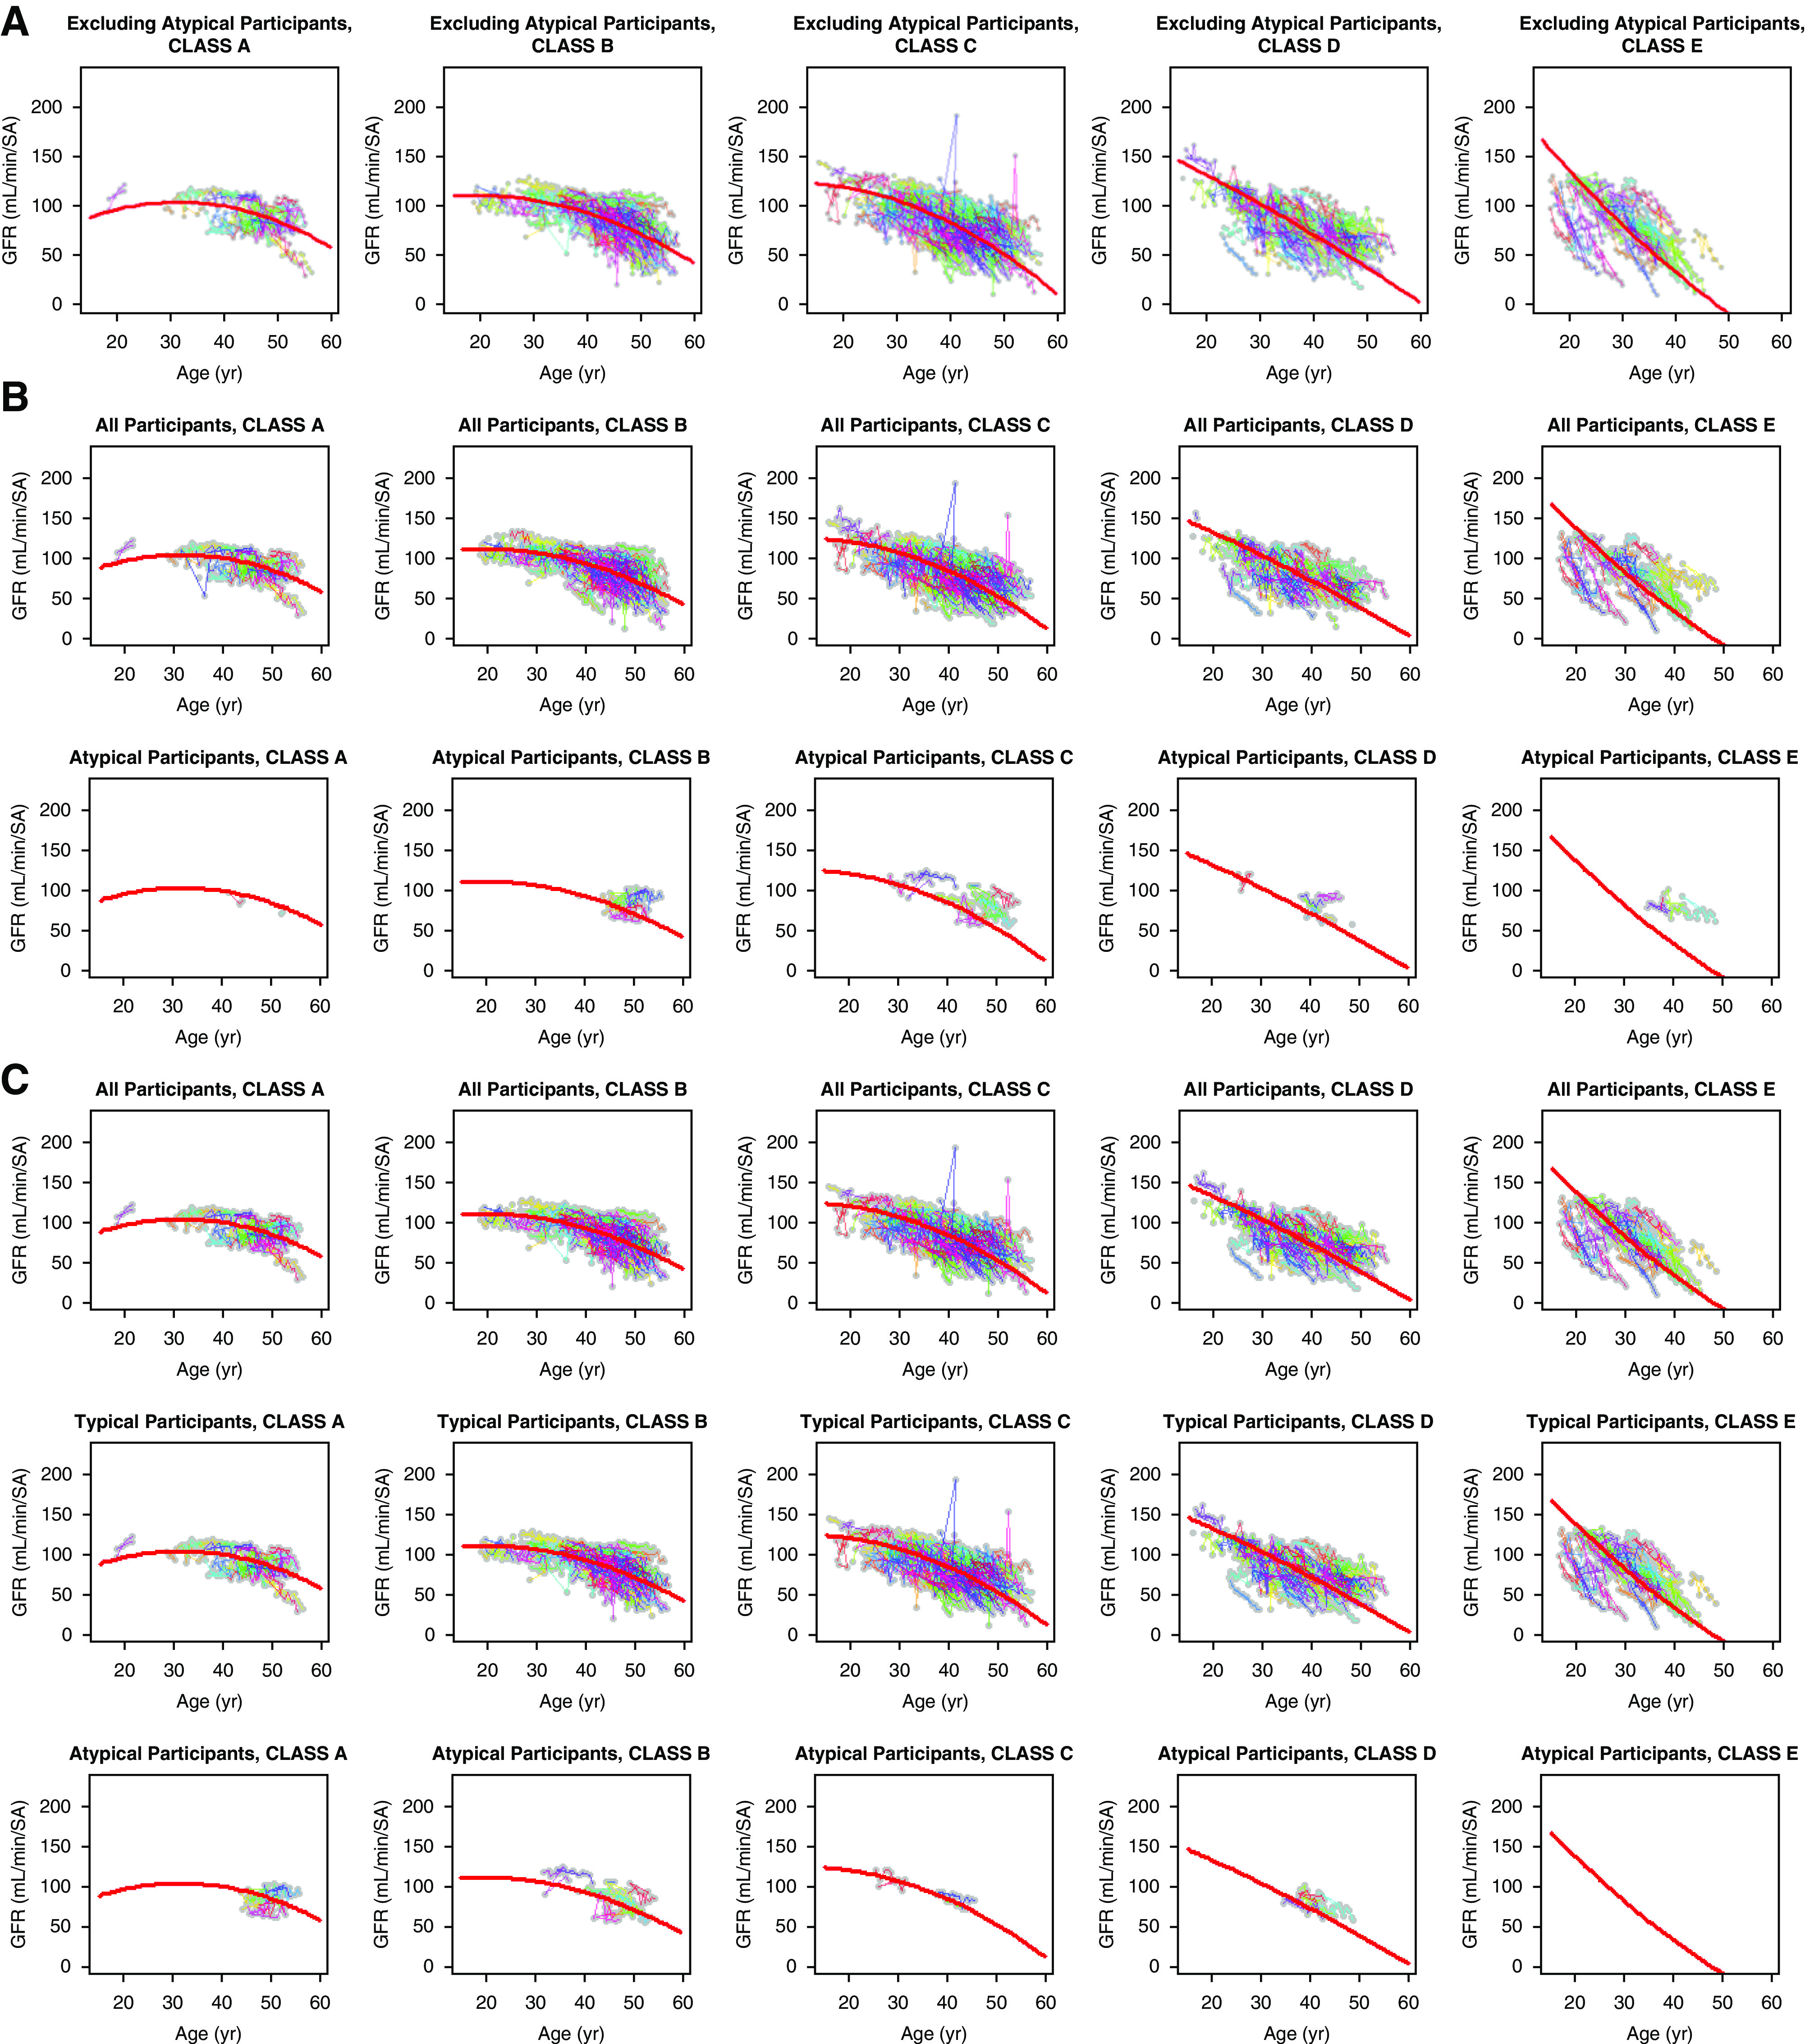
Figure 5.

eGFR trajectories. eGFR trajectories are shown for (A) class 1 participants only, (B) all and class 2Ae participants with original imaging classes, and (C) all, class 1, and class 2Ae participants with recalculated imaging classes. The data from class 1 only were used to fit the predicted curves, the trend of which was then assessed on the other groups of participants.
