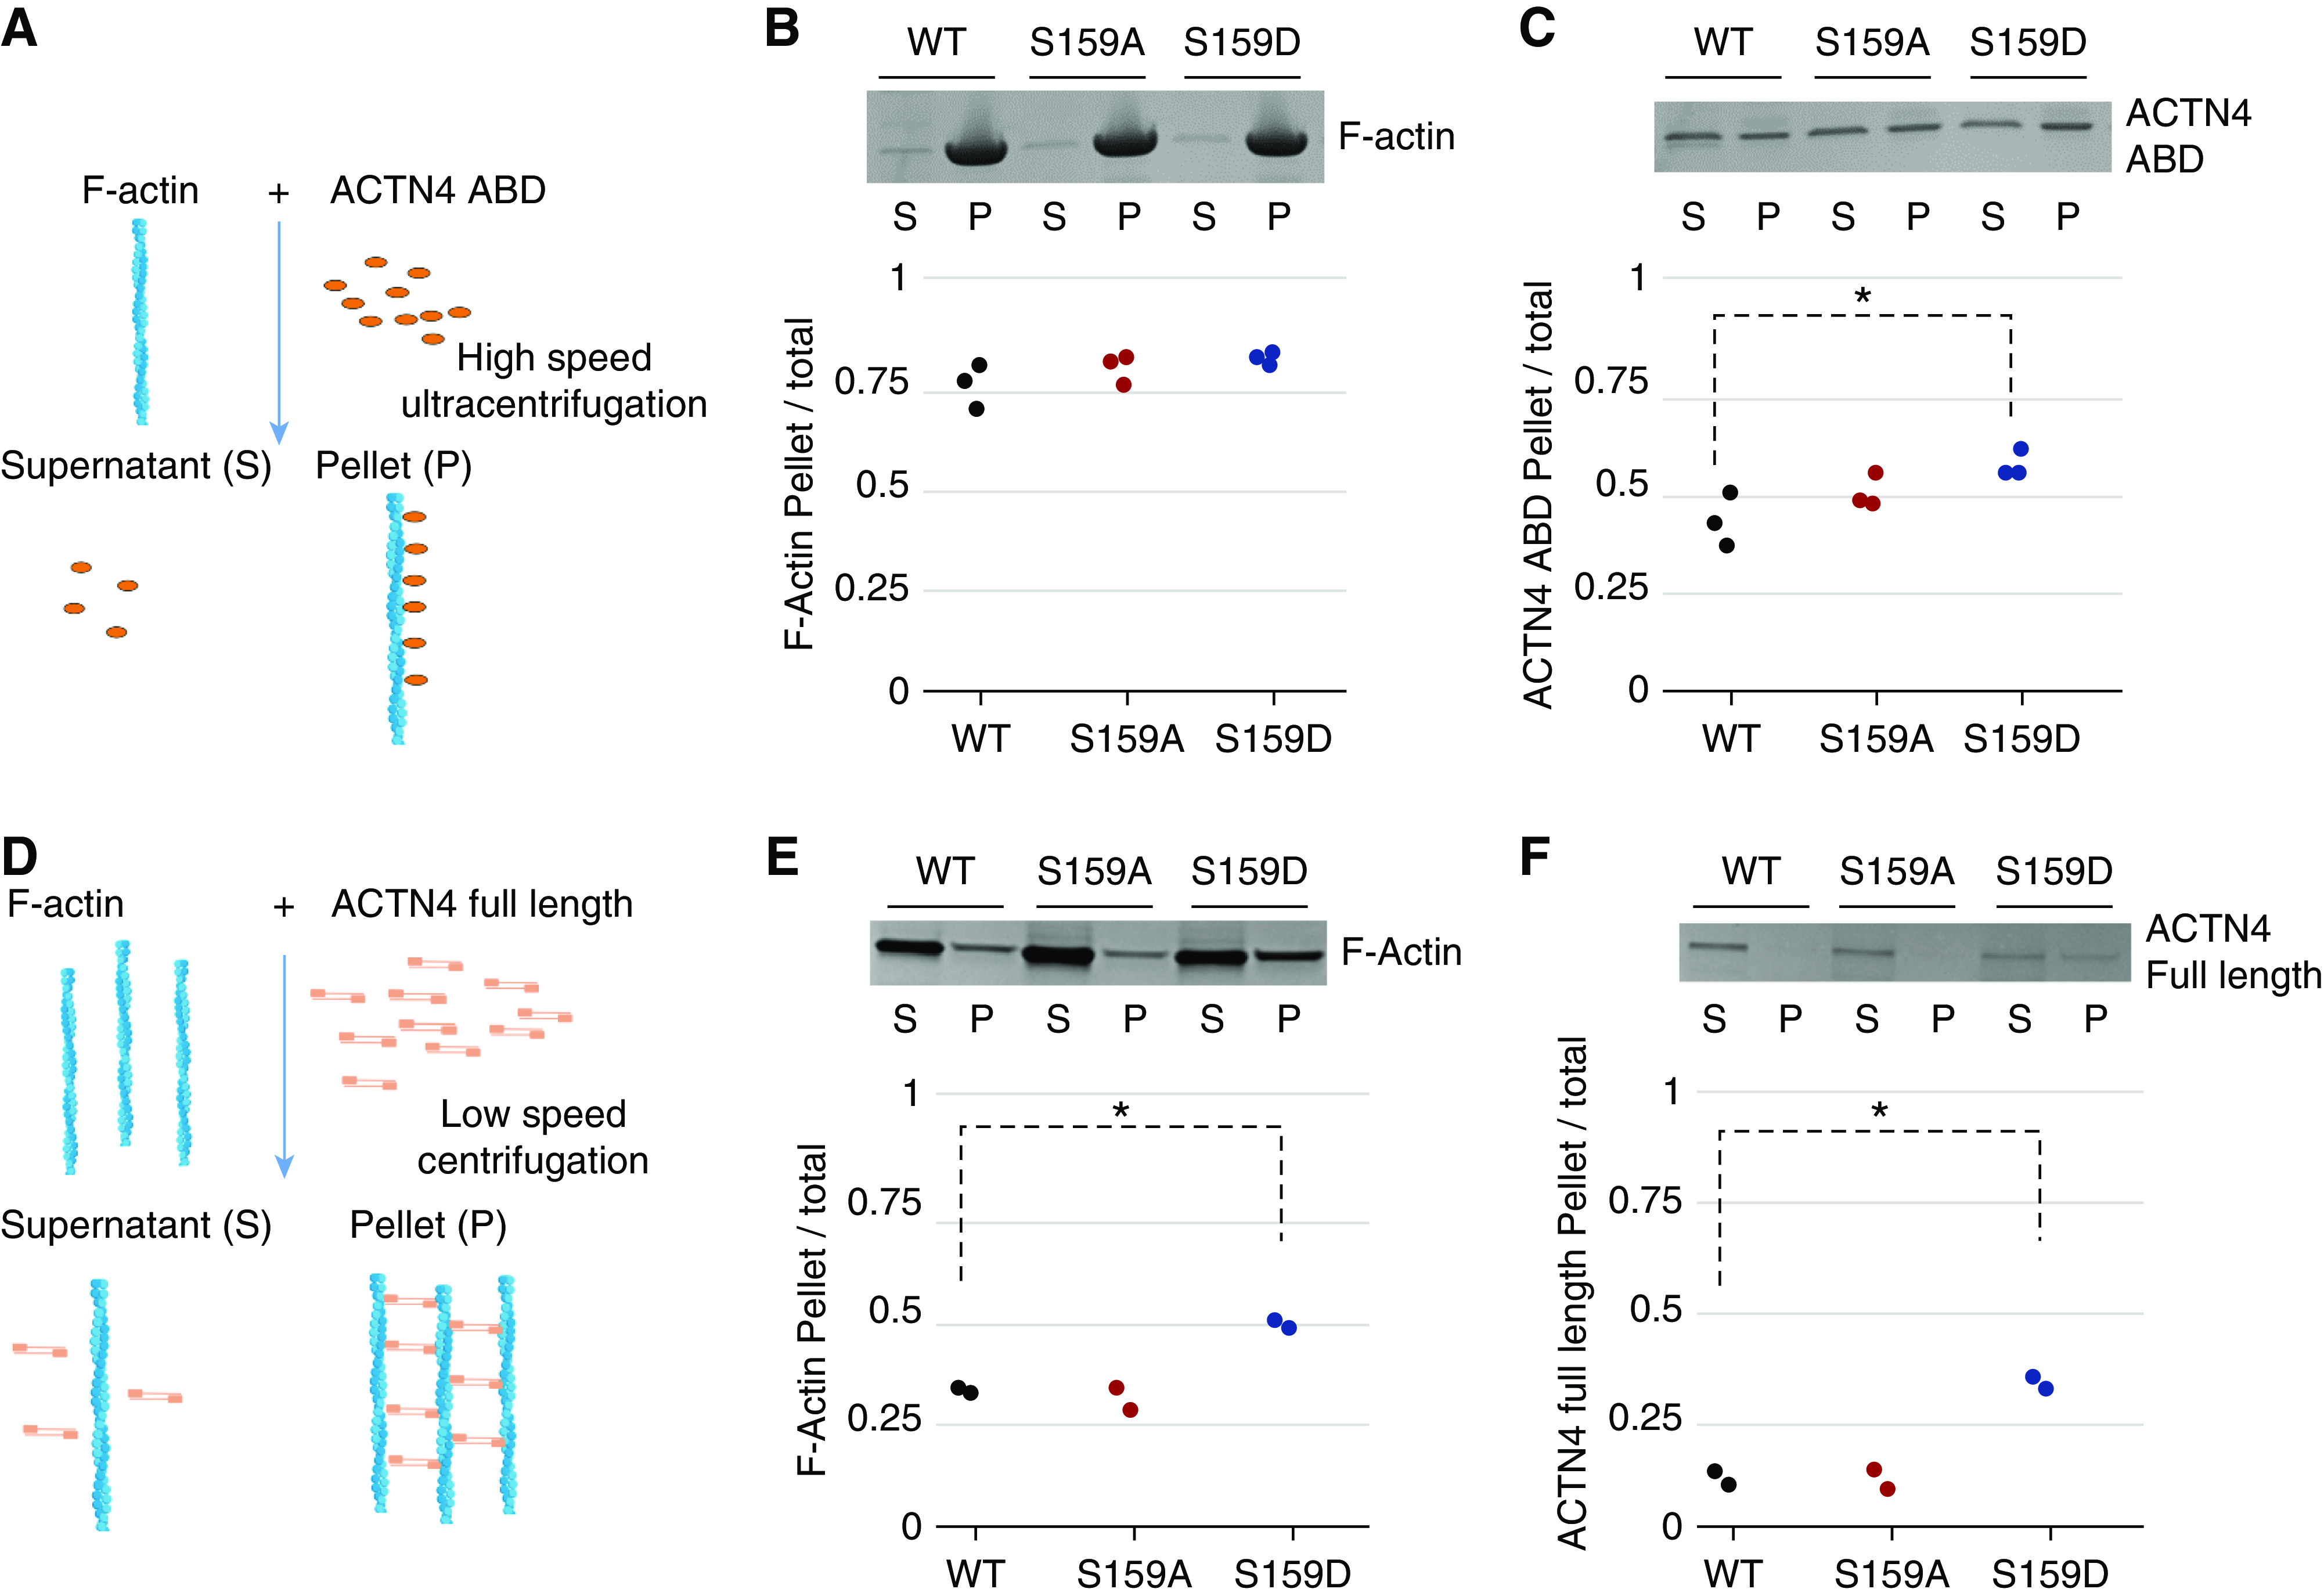
Figure 3.

Phosphomimetic S159D ACTN4 demonstrates increased F-actin binding affinity and F-actin bundling activity. (A) Illustration of F-actin binding assay. F-actin was incubated with the ABD of WT, S159A, and S159D ACTN4. These ABDs were used to assess binding affinity to F-actin. After high-speed ultracentrifugation, the pellet (P) contains ACTN4 ABD bound to F-actin, and supernatant (S) contains unbound ACTN4 ABD. The higher the binding affinity, the higher the ratio of ACTN4 ABD in the P to total amount. (B) Representative image of Coomassie Blue–stained SDS-PAGE gel of F-actin (one of three independent experiments). Bands correspond to the amount of F-actin in S and P after ultracentrifugation. Dot plots show ratios of the amount of F-actin in the P to the total amount of F-actin. (C) Representative image of Coomassie Blue–stained SDS-PAGE gel of ACTN4 ABD (one of three independent experiments). Bands correspond to the amount of ACTN4 ABD in S and P after ultracentrifugation. Dot plots show the ratio of the amount of ACTN4 ABD in the P to the total amount of ACTN4 ABD. (D) Illustration of bundling assay. F-actin was incubated with full-length WT, S159A, and S159D ACTN4 proteins. Full-length ACTN4 protein forms antiparallel homodimers with an ABD at either end, enabling an assessment of actin bundling. After low-speed centrifugation, the P contains F-actin bundled by full-length ACTN4, and the S contains unbundled F-actin and full-length ACTN4. The higher the bundling activity, the higher the ratio of full-length ACTN4-bundled F-actin in the P to total amount. (E) Representative image of Coomassie Blue–stained SDS-PAGE gel of full-length ACTN4 (one of two independent experiments). Bands correspond to the amount of F-actin in S and P after centrifugation. Dot plots show ratios of the amount of F-actin in the P to the total amount of F-actin. (F) Representative image of Coomassie Blue–stained SDS-PAGE gel of F-actin (one of two independent experiments). Bands correspond to the amount of full-length ACTN4 in S and P after centrifugation. Dot plots show ratios of the amount of full-length ACTN4 protein in the P to total amount of full-length ACTN4 protein. *Significant difference from the WT ( P<0.05, t test).
