Figure 7.

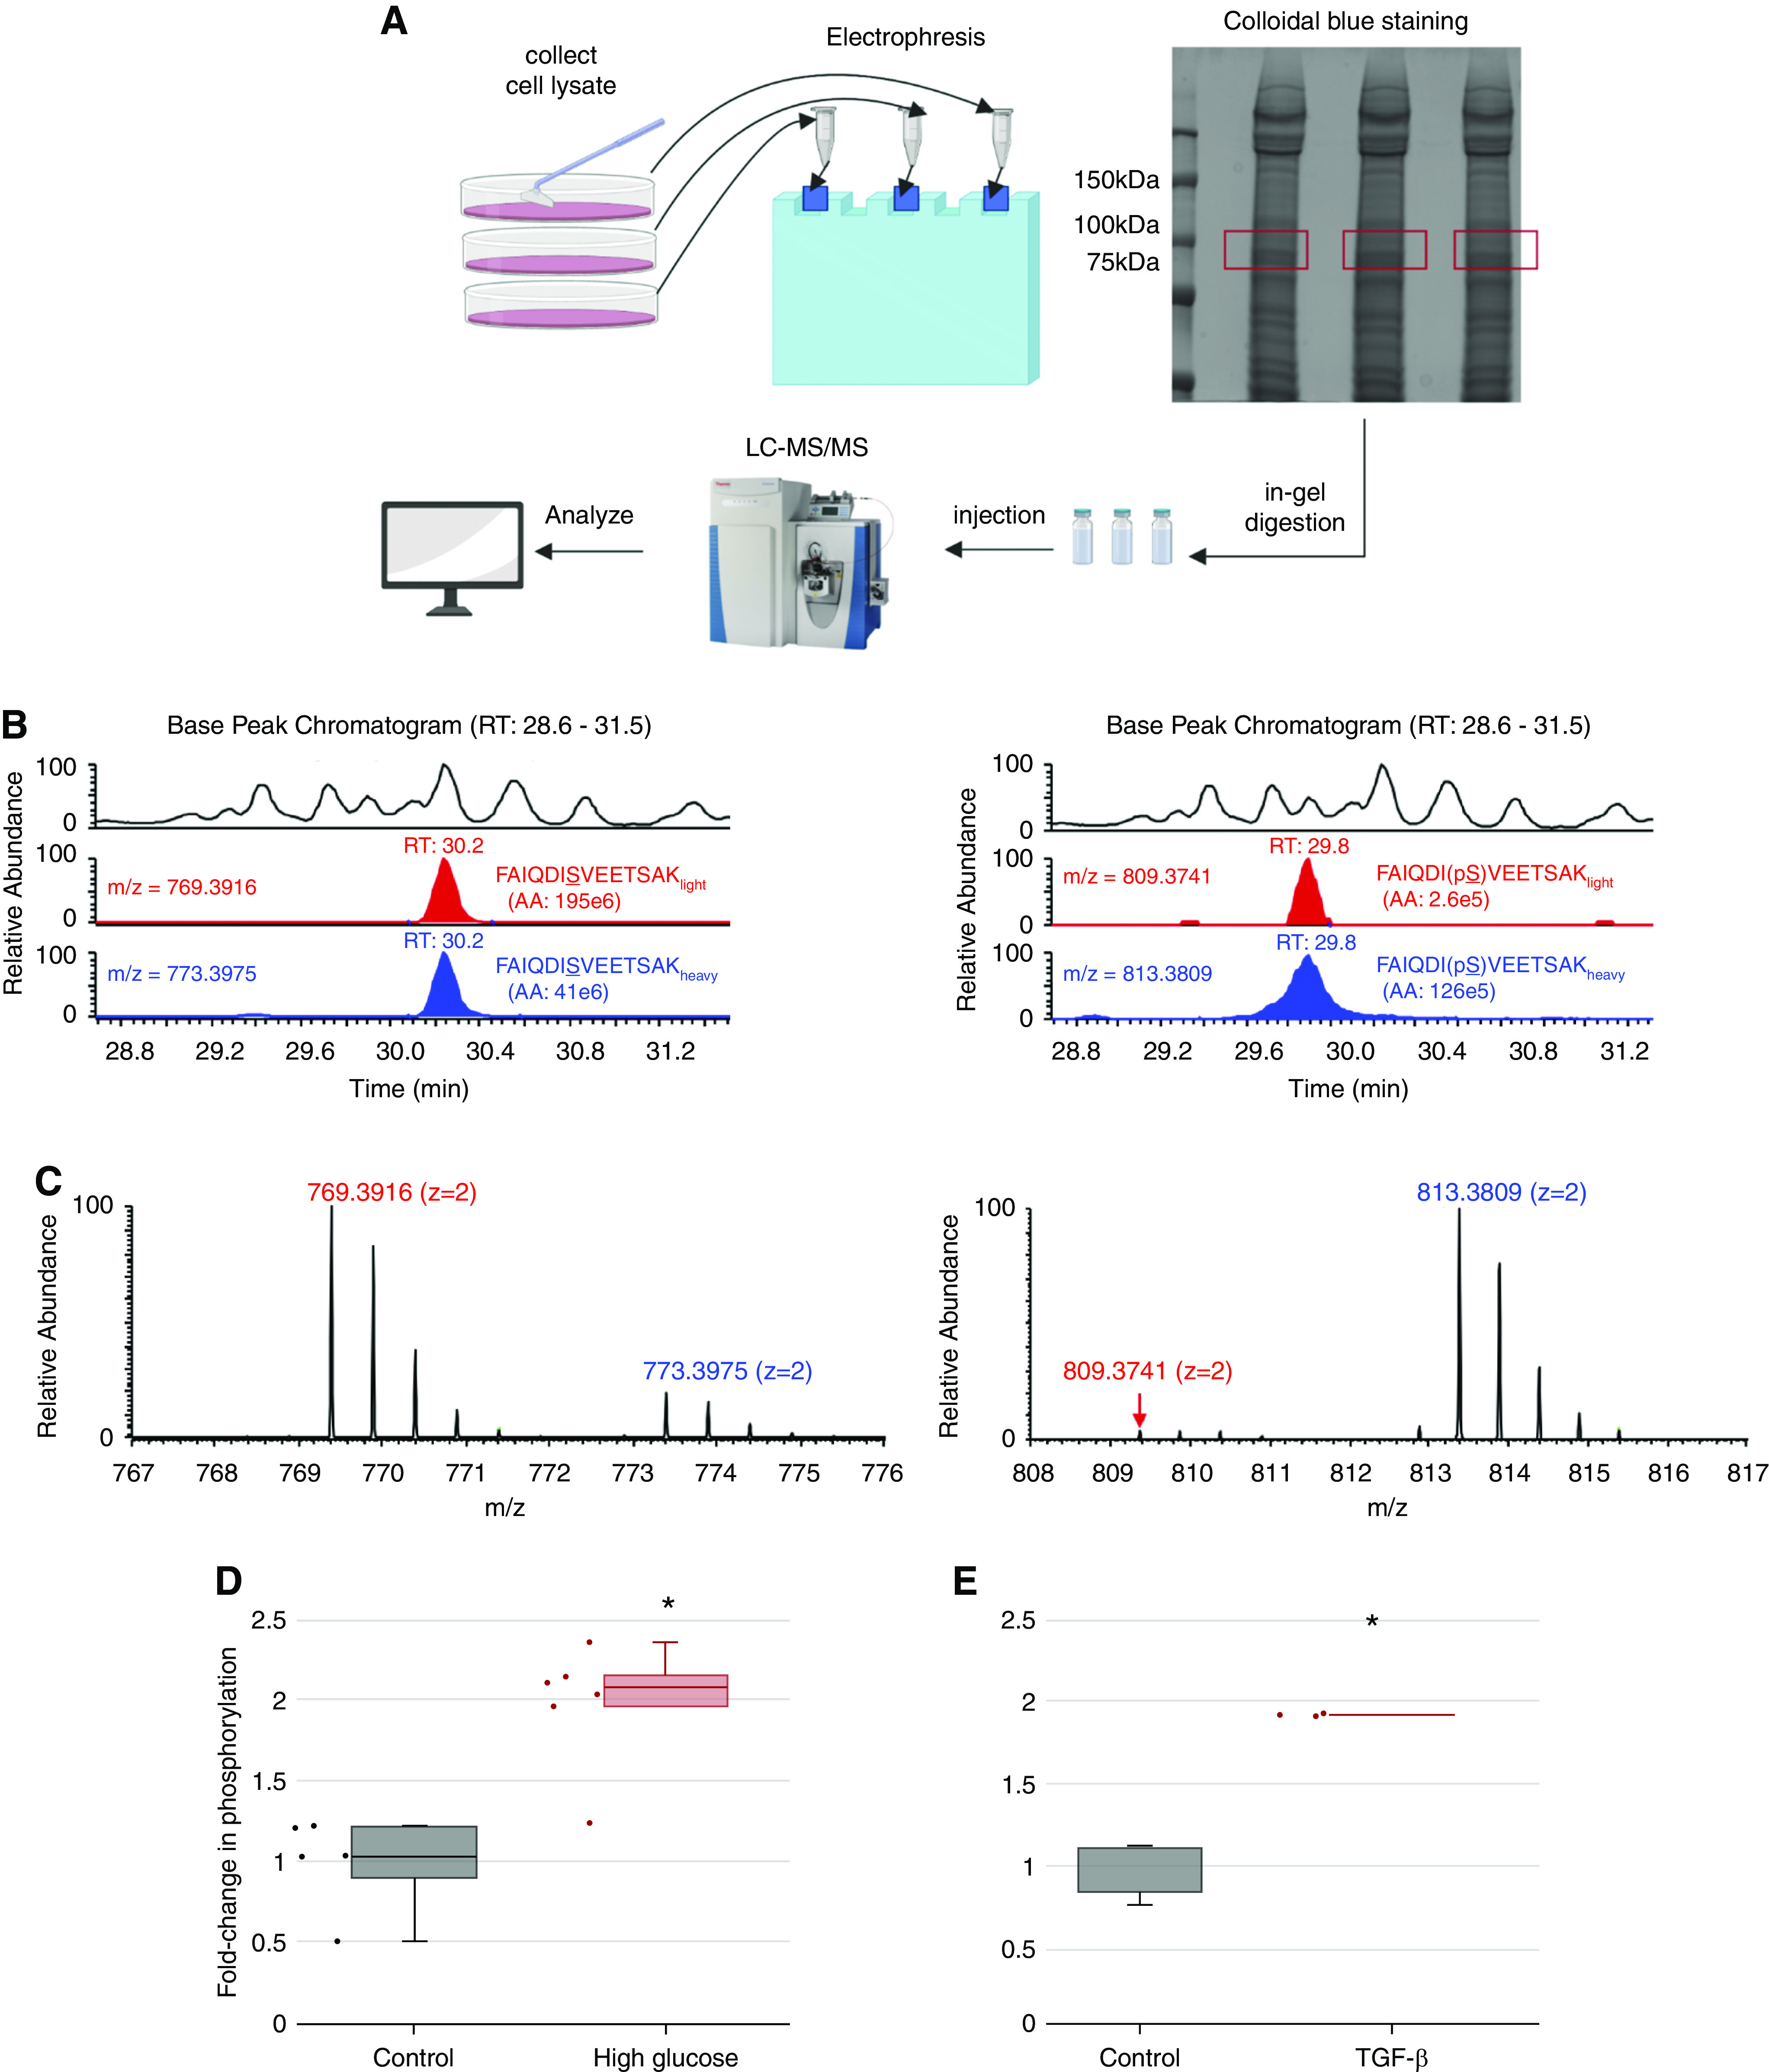
High extracellular glucose and TGF-β stimulate ACTN phosphorylation at S159. (A) Workflow for identification and quantification of peptide phosphorylation by mass spectrometry. Proteins from podocyte lysates were separated by SDS-PAGE and visualized by colloidal blue staining. Prior to mass spectrometry, the gel slice corresponding to the target protein (highlighted in red; around 105 kD) was excised, digested with trypsin, and extracted following in-gel digestion protocol. Tryptic peptides were analyzed by liquid chromatography tandem mass spectrometry (LC-MS/MS). (B) Identification and quantification of target peptide by mass spectrometry. Left panel (from top to bottom) shows the representative zoomed base peak chromatogram of the full mass spectrum, extracted ion chromatogram (XIC) of FAIQDISVEETSAKlight (red), and XIC of FAIQDISVEETSAKheavy (blue) with matching retention times at 30.2 minutes. Right panel (from top to bottom) shows the representative zoomed base peak chromatogram of the full mass spectrum, XIC of FAIQDI(pS)VEETSAKlight (red), and XIC of FAIQDI159(pS)VEETSAKheavy (blue) with matching retention times at 29.8 minutes. RT, room temperature. (C) Mass spectrum of nonphosphopeptide and phosphopeptide. (Left panel) Mass spectra of doubly charged nonphosphopeptide FAIQDISVEETSAKlight and FAIQDISVEETSAKheavy are shown at m/z 769.3916 (z=2) and 773.3975 (z=2), respectively. (Right panel) Mass spectra of doubly charged phosphopeptide FAIQDI(pS)VEETSAKlight and FAIQDI159(pS)VEETSAKheavy are shown at m/z 809.3741(z=2) and 813.3809 (z=2), respectively. (D) Effect of glucose on ACTN phosphorylation at S159. Samples were derived from human podocytes cultured in either high glucose medium (4.5 g/L) or mannitol control base RPMI medium. The phosphorylation level for each sample was calculated using the following equation:  . The numerator of this ratio reflects the amount of phosphopeptide, and the denominator reflects the amount of nonphosphopeptide. The equation, therefore, calculates the ratio of phosphopeptide to nonphosphopeptide for each sample. The average ratio of phosphopeptide to nonphosphopeptide was calculated for the control group, and all results were normalized by this value to represent the fold change of phosphorylation (y axis) in response to high glucose treatment. *Significant difference from control (P<0.01, t test). (E) Effect of TGF-β treatment on ACTN phosphorylation at S159. Samples were derived from human podocytes cultured in base RPMI medium with or without TGF-β treatment (20 ng/ml). *Significant difference from control (P<0.01, t test).
