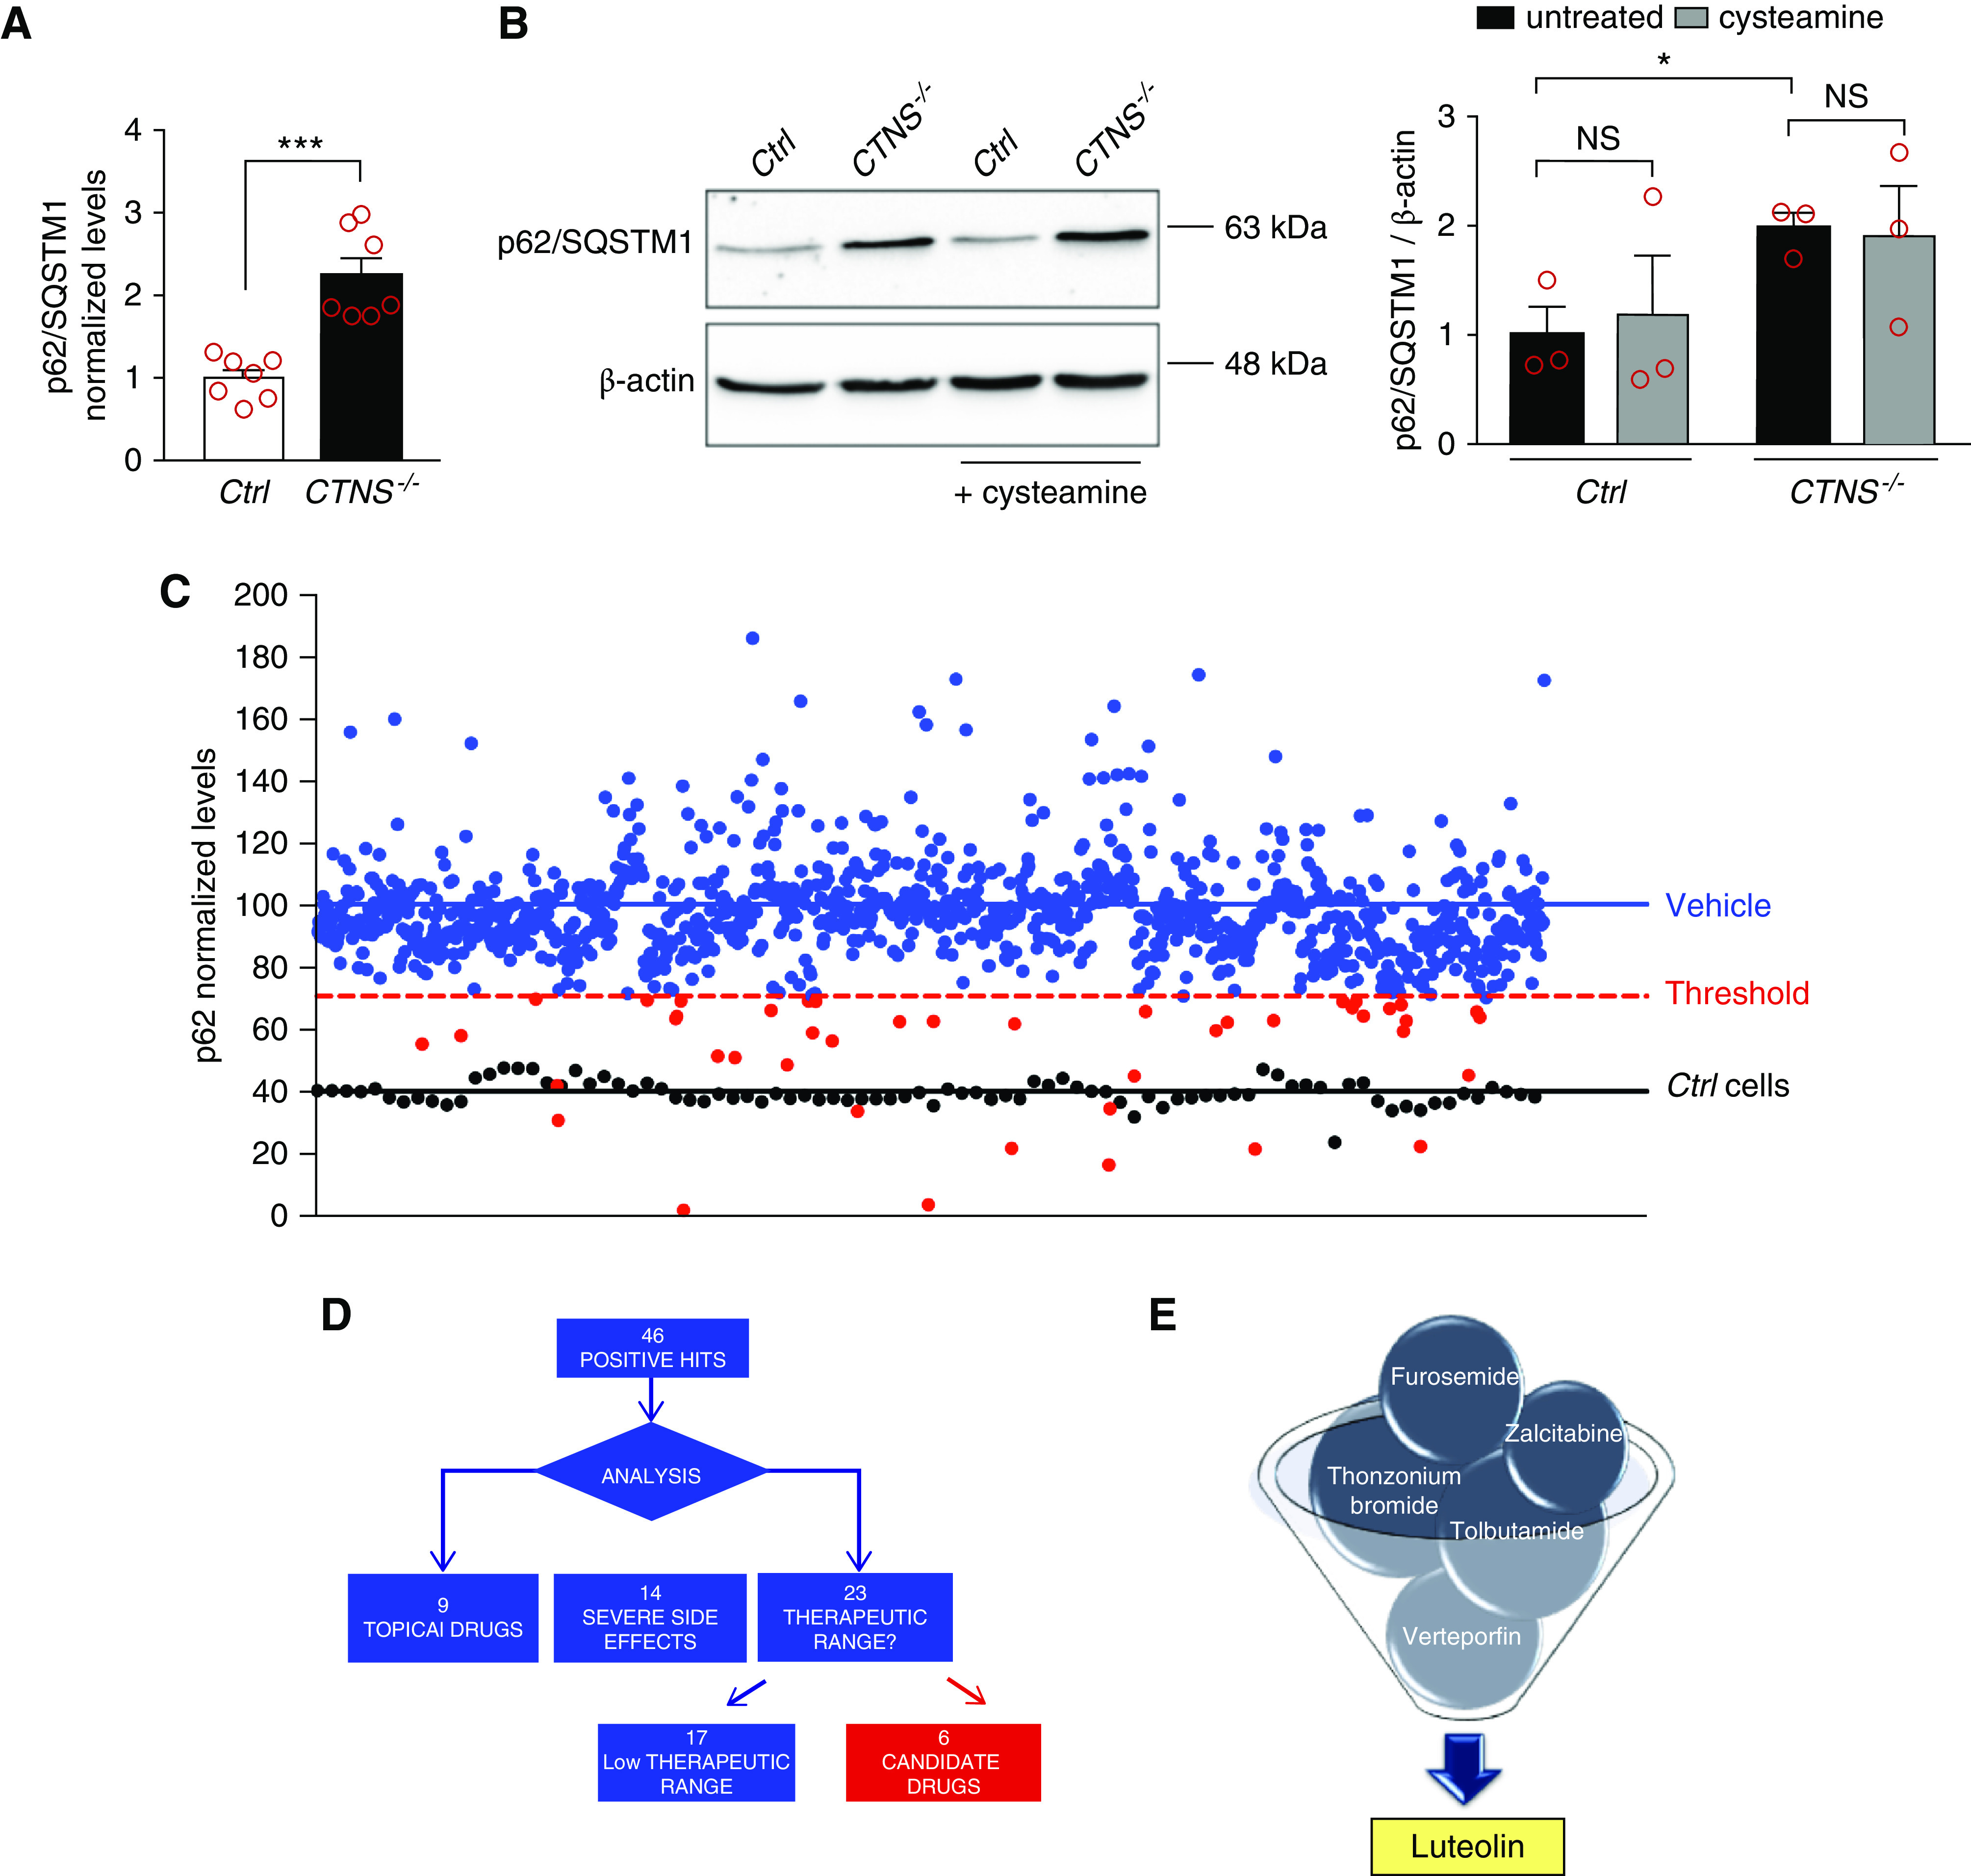
Figure 1.

Cell-based phenotypic drug screening for compounds that reduce p62/SQSTM1 levels. (A) p62/SQSTM1 protein levels were analyzed in ciPTCs from a healthy donor (Ctrl) and a patient with cystinosis (CTNS−/−) by in-cell ELISA. Levels of p62/SQSTM1 were normalized by Janus Green cell stain. Data are shown as fold change of untreated Ctrl. Mean values±SEM from seven independent experiments are reported. t test ***P<0.001. (B) Western blotting and densitometric analysis of p62/SQSTM1 and β-actin levels in Ctrl and CTNS−/− ciPTC after treatment with 100 μM cysteamine for 24 hours. Histogram shows levels of p62/SQSTM1 normalized to those of β-actin and reported as relative to untreated Ctrl ratios. Data are shown as mean±SEM from three independent experiments. t test *P<0.05; NS not statistically significant. (C) p62/SQSTM1 levels were analyzed in CTNS−/− ciPTCs after treatment with DMSO (vehicle, negative control) or 10 μM of each drug of the Prestwick Chemical Library (red and blue dots). Ctrl cells were used as positive control (black dots). The threshold for significance (red dashed line) was set at 50% reduction in the relative increased p62/SQSTM1 levels in CTNS−/− ciPTCs (blue line) compared with Ctrl cells (black line). This threshold highlights 46 positive hits (red spots). Levels of p62/SQSTM1 were normalized to Janus Green cell stain signal. Data are represented as mean value of three independent experiments. (D and E) Diagram represents process of selection of six candidate drugs. The screening yielded 46 positive hits, of which nine drugs were excluded because they are registered for topical use only, 14 because of severe side effects, and 17 because of their low therapeutic range.
