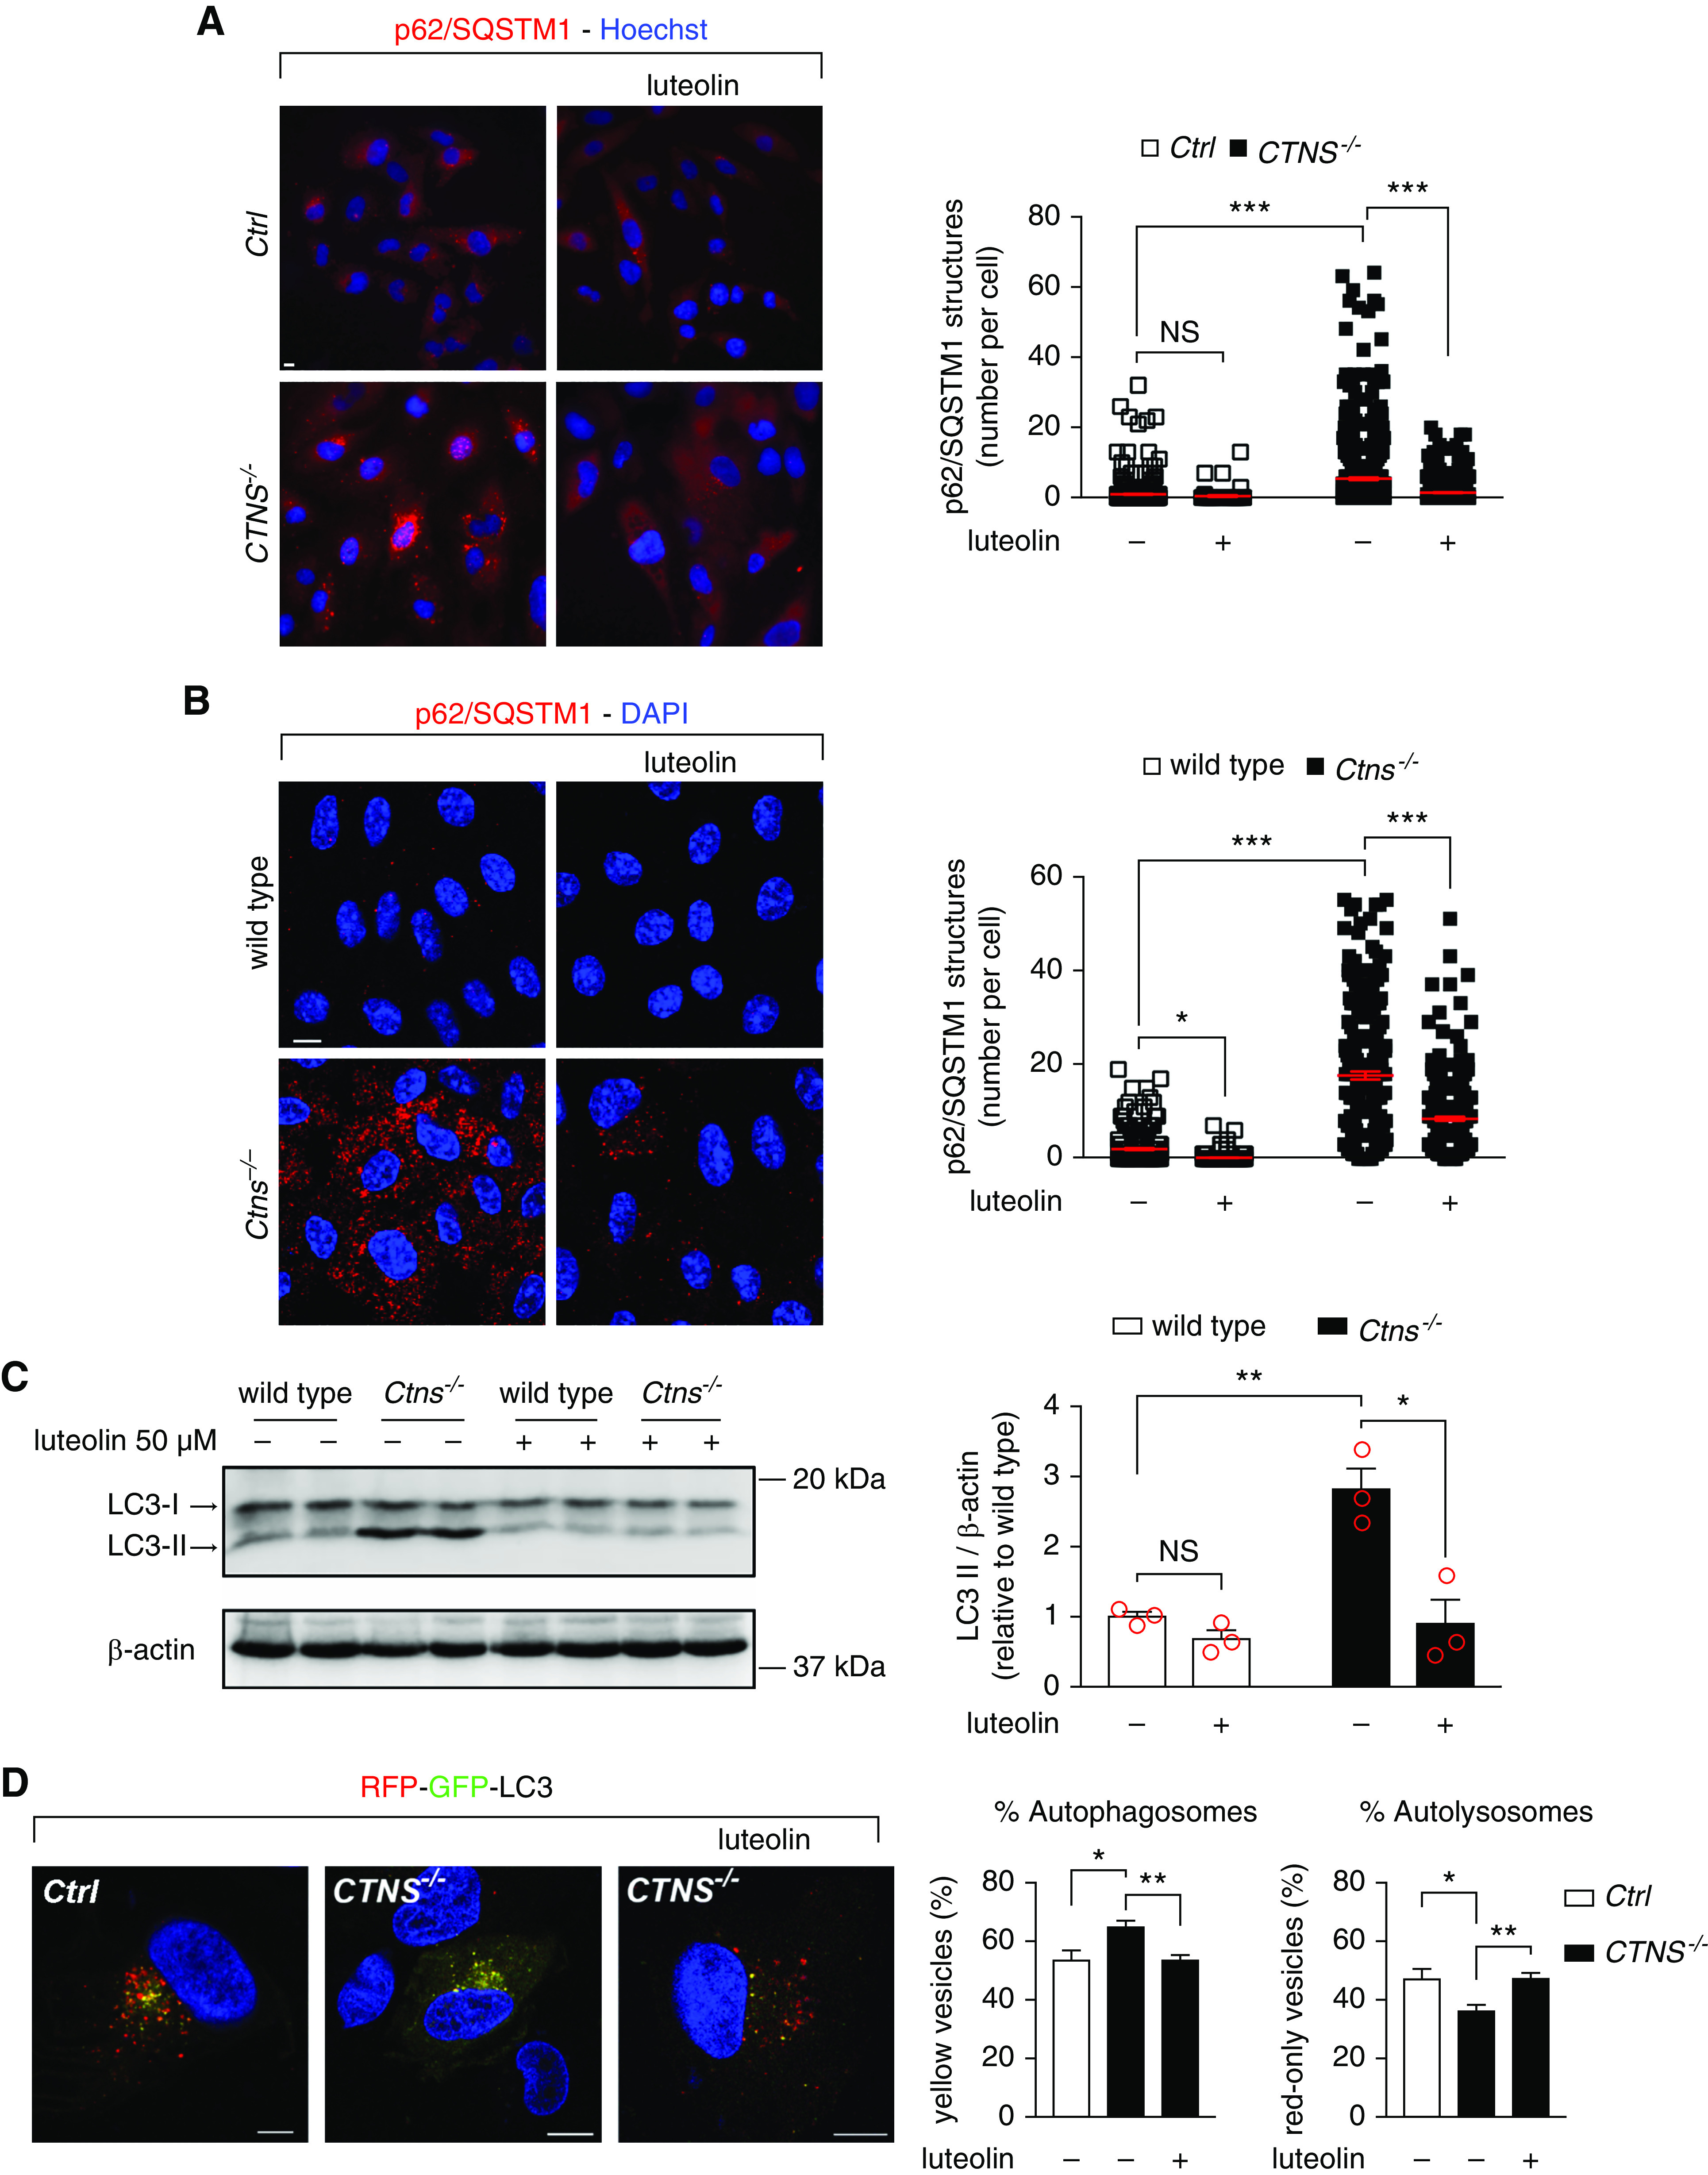
Figure 3.

Luteolin rescues autophagic defects in cystinosis. (A) Representative images of Ctrl and CTNS−/− ciPTCs after treatment with 50 μM luteolin for 24 hours. After fixing, cells were stained with anti-p62/SQSTM1 antibody (red) and Hoechst (nuclei, blue). Scale bar is 10 μm. Graph represents number of p62/SQSTM1-positive structures per cells (n>70 cells from three independent experiments, one-way ANOVA followed by Bonferroni post hoc test, ***P<0.001 and NS not statistically significant). (B) Representative images of wild-type and Ctns−/− mPTCs after treatment with 50 μM luteolin for 24 hours. After fixing, cells were stained with anti-p62/SQSTM1 antibodies (red) and DAPI (nuclei, blue). Scale bar is 10 μm. Graph represents number of p62/SQSTM1-positive structures per cell (n>214). One-way ANOVA followed by Bonferroni post hoc test, *P<0.05 and ***P<0.001. (C) Western blotting and densitometric analyses of LC3 and β-actin protein levels in mPTCs after treatment with 50 µM luteolin for 24 hours. Data are shown as mean±SEM (n=3 independent experiments), t test *P<0.05; **P<0.01 and NS not statistically significant. (D) Representative images of Ctrl and CTNS−/− ciPTCs transfected with RFP-GFP-LC3. After 24 hours from transient transfection, cells were left untreated or treated with 50 µM luteolin for 24 hours. Scale bar is 10 µm. GFP and RFP signals were analyzed by confocal microscopy. Percentage of autophagosomes (yellow vesicles) and percentage of autolysosomes (red-only vesicles) were calculated on the basis of the ratio between the number of yellow and red-only puncta, respectively, and the total number of autophagosomes (number of yellow and red-only puncta). Data are reported as mean±SEM (n>70 cells from five independent experiments). One-way ANOVA followed by Bonferroni post hoc test, **P<0.01 and *P<0.05.
