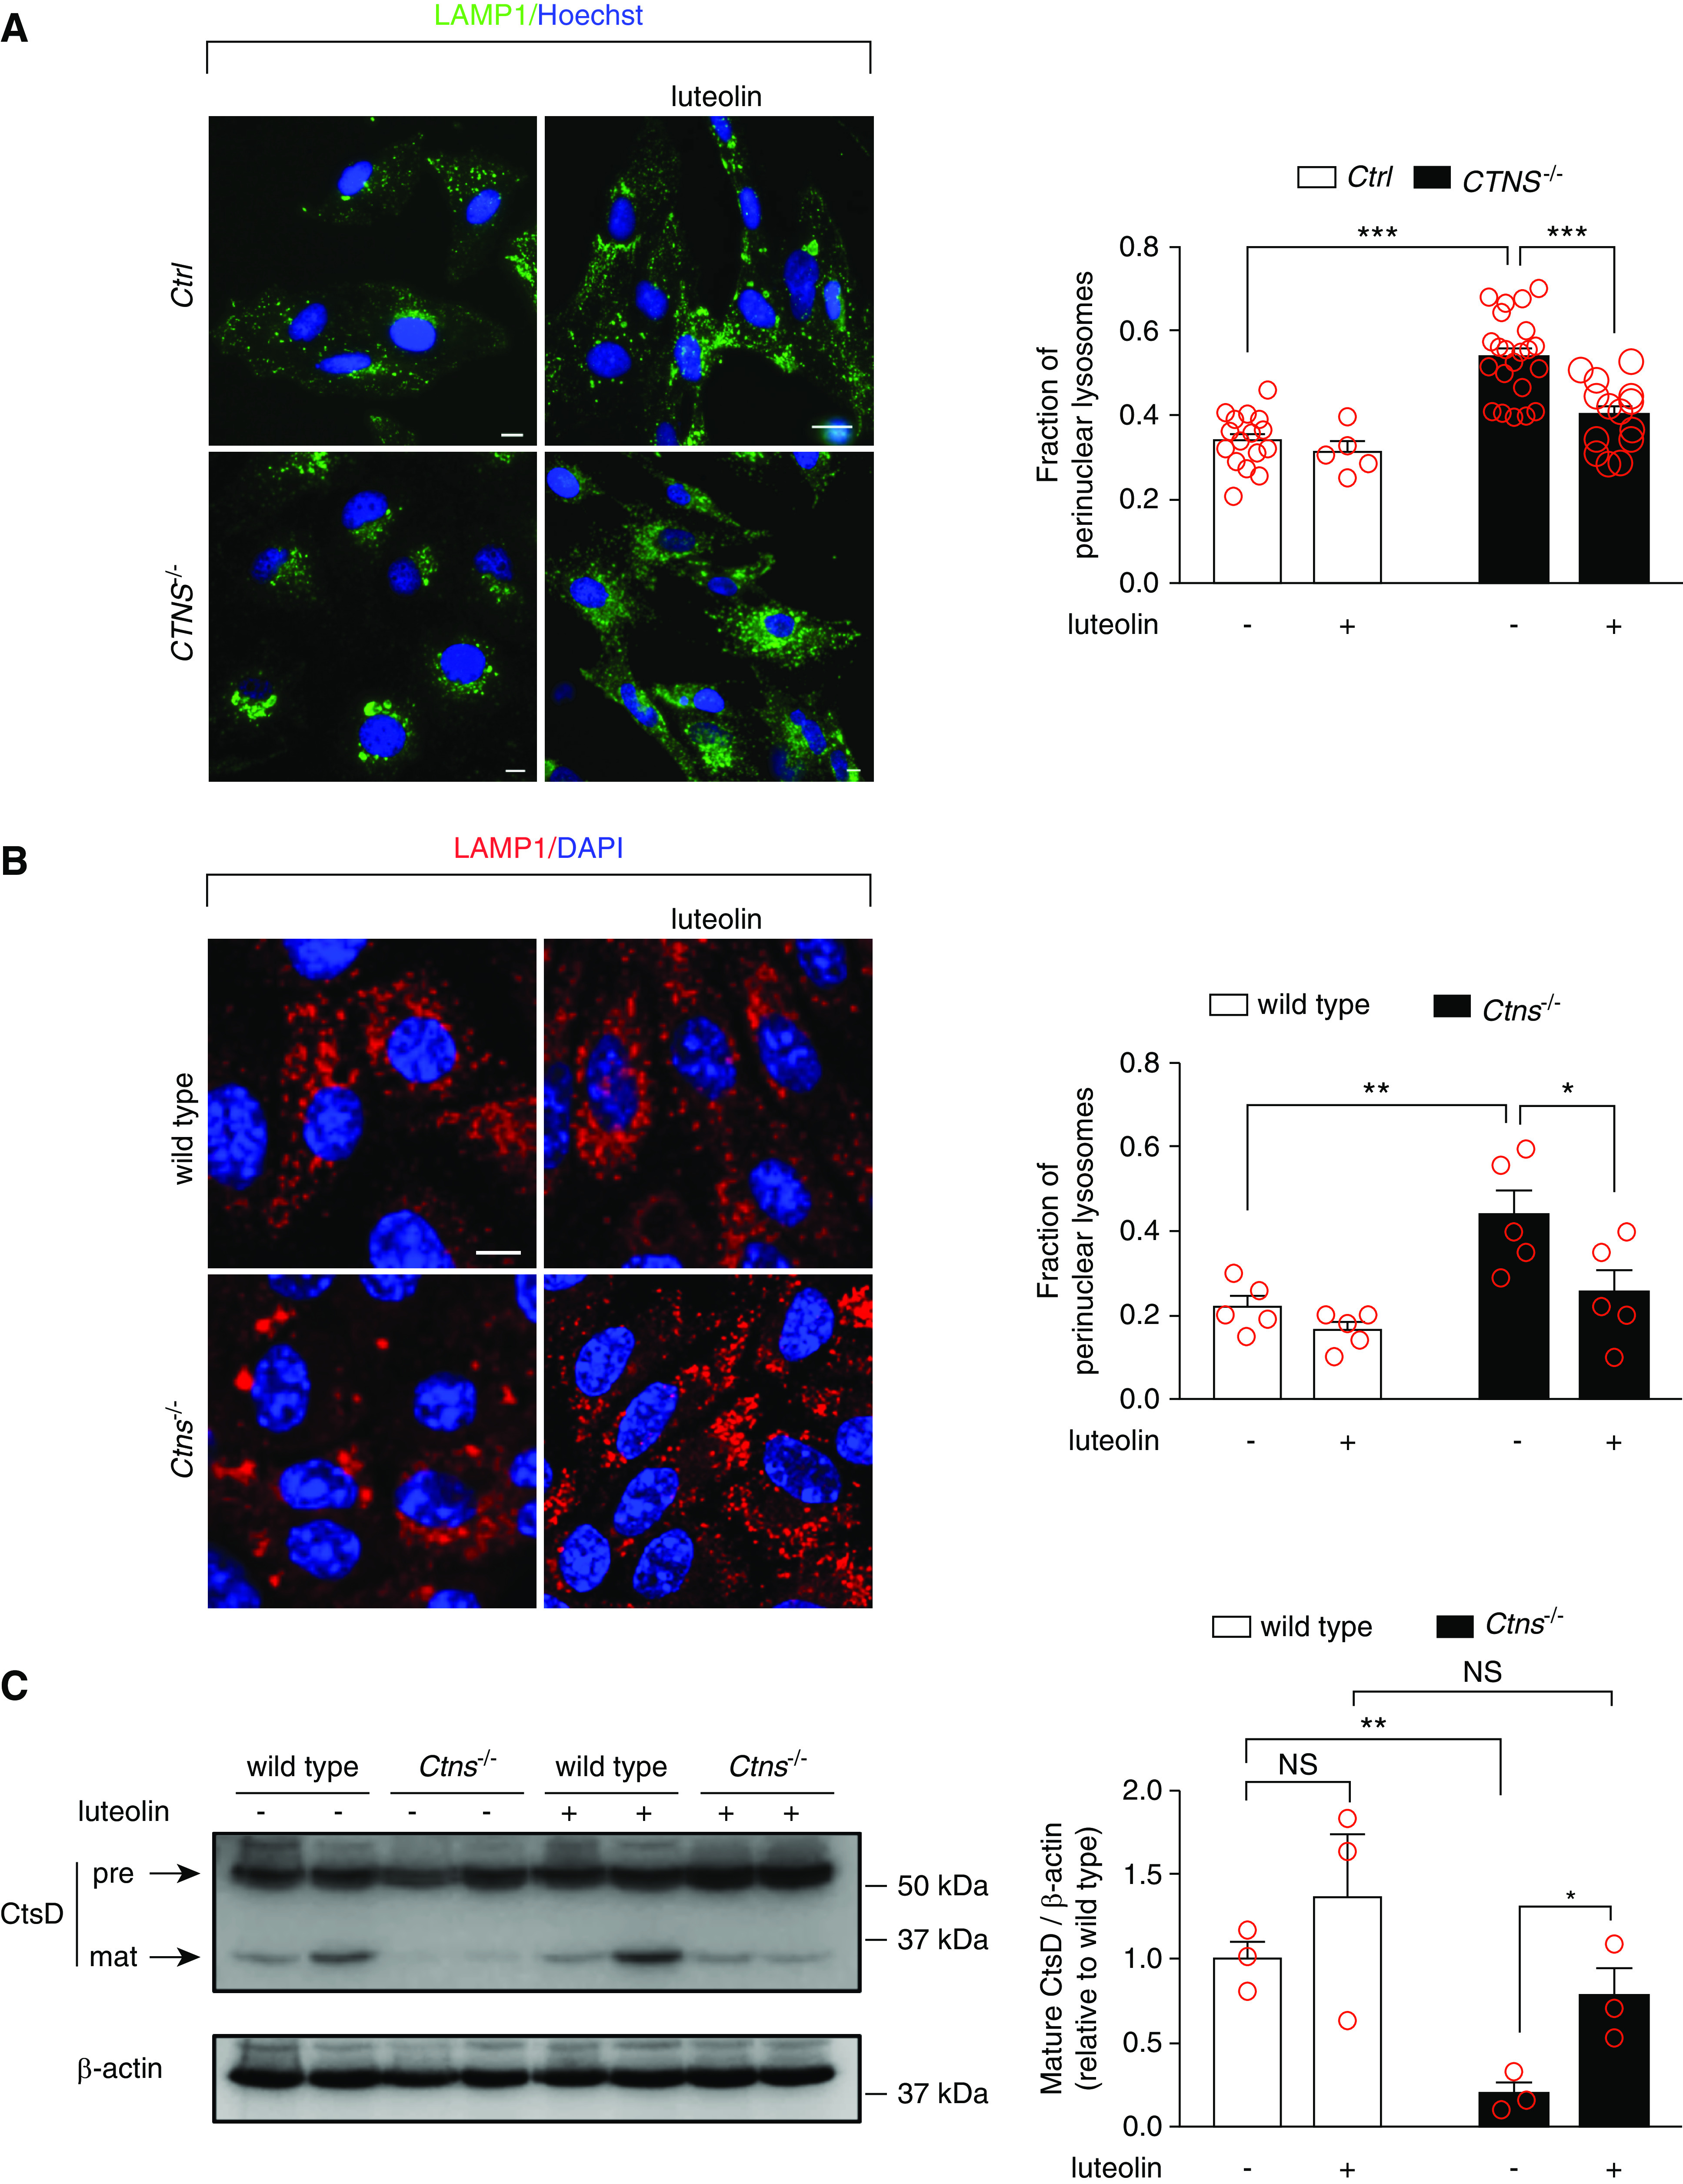
Figure 6.

Luteolin treatment rescues morphology and degradation capacities of lysosomes in cystinotic cells. (A) Representative images of Ctrl and CTNS−/− ciPTCs left untreated or treated with 50 μM luteolin for 24 hours. After fixing, cells were stained with anti–lysosome-associated membrane protein 1 (LAMP1) antibody (green) and Hoechst (nuclei, blue). Scale bar is 10 µm. Fraction of perinuclear lysosomes was quantified in at least five randomly selected fields (red circles) per condition. Mean±SEM are shown by column bars. One-way ANOVA followed by Bonferroni post hoc test, ***P<0.001 . (B) Representative images of wild-type and Ctns−/− mPTCs under basal condition or treatment with 50 μM luteolin for 24 hours. After fixing, cells were stained with anti-LAMP1 antibody (red) and DAPI (nuclei, blue). Scale bar is 10 µm. Fraction of perinuclear lysosomes was quantified in at least five randomly selected fields (red circles) per condition. Mean±SEM are shown by column bars. One-way ANOVA followed by Bonferroni post hoc test, *P<0.05 and **P<0.01. (C) Western blotting and densitometric analysis of cathepsin-D (CtsD) and β-actin protein levels from wild-type and Ctns−/− mPTCs, left untreated or treated with 50 µM luteolin for 24 hours. Histogram shows levels of mature CtsD (33 kDa) normalized to those of β-actin and reported as relative to control wild-type ratios (n=3 independent experiments). t test *P<0.05; **P<0.01 and NS not statistically significant.
